This site uses cookies to improve your experience. To help us insure we adhere to various privacy regulations, please select your country/region of residence. If you do not select a country, we will assume you are from the United States. Select your Cookie Settings or view our Privacy Policy and Terms of Use.
Cookie Settings
Cookies and similar technologies are used on this website for proper function of the website, for tracking performance analytics and for marketing purposes. We and some of our third-party providers may use cookie data for various purposes. Please review the cookie settings below and choose your preference.
Used for the proper function of the website
Used for monitoring website traffic and interactions
Cookie Settings
Cookies and similar technologies are used on this website for proper function of the website, for tracking performance analytics and for marketing purposes. We and some of our third-party providers may use cookie data for various purposes. Please review the cookie settings below and choose your preference.
Strictly Necessary: Used for the proper function of the website
Performance/Analytics: Used for monitoring website traffic and interactions
One key factor that significantly affects the performance of data processing is the storage format of the data. This article explores the impact of different storage formats, specifically Parquet, Avro, and ORC on query performance and costs in big data environments on Google Cloud Platform (GCP).
To do this I needed to drive postgres to do real transactions but have very little jitter/noise from the filesystem and storage. After reading a lot of blogs I came … The post Notes on tuning postgres for cpu and memory benchmarking appeared first on n0derunner.
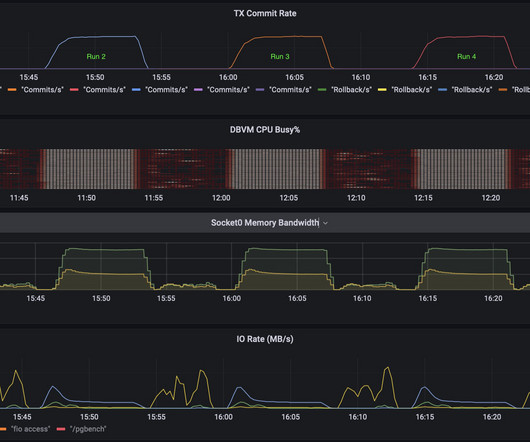
As more organizations move their PostgreSQL databases onto Kubernetes, a common question arises: Which storage solution best handles its demands? For stateful workloads like PostgreSQL, storage must offer high availability and safeguard data integrity, even under intense, high-volume conditions.
This article analyzes the correlation between block sizes and their impact on storage performance. This paper deals with definitions and understanding of structured data vs unstructured data, how various storage segments react to block size changes, and differences between I/O-driven and throughput-driven workloads.
Message brokers handle validation, routing, storage, and delivery, ensuring efficient and reliable communication. Message Broker vs. Distributed Event Streaming Platform RabbitMQ functions as a message broker, managing message confirmation, routing, storage, and delivery within a queue. What is RabbitMQ?
Performance Benchmarking of PostgreSQL on ScaleGrid vs. AWS RDS Using Sysbench This article evaluates PostgreSQL’s performance on ScaleGrid and AWS RDS, focusing on versions 13, 14, and 15. This study benchmarks PostgreSQL performance across two leading managed database platforms—ScaleGrid and AWS RDS—using versions 13, 14, and 15.
ScaleGrid provides 30% more storage on average vs. DigitalOcean for MySQL at the same affordable price. MySQL DigitalOcean Performance Benchmark. In this benchmark, we compare equivalent plan sizes between ScaleGrid MySQL on DigitalOcean and DigitalOcean Managed Databases for MySQL. Read-Intensive Throughput Benchmark.
On average, ScaleGrid provides over 30% more storage vs. DigitalOcean for PostgreSQL at the same affordable price. PostgreSQL Benchmark Setup. Here is the configuration we used for the ScaleGrid and DigitalOcean benchmark performance tests highlighted above: Configuration. Benchmark Tool. Compare Pricing. Deployment Type.
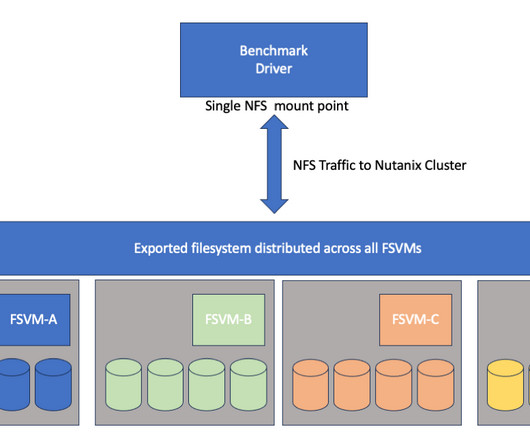
The post View from Nutanix storage during Postgres DB benchmark appeared first on n0derunner. Even though the log writes are sequential, they are low-concurrency and small size (looks like mostly 16K-32K). This write pattern is also a good candidate for oplog. These low-concurrency log writes also hit oplog.
IT infrastructure is the heart of your digital business and connects every area – physical and virtual servers, storage, databases, networks, cloud services. This shift requires infrastructure monitoring to ensure all your components work together across applications, operating systems, storage, servers, virtualization, and more.
ScaleGrid’s MySQL, PostgreSQL and Redis™ solutions on DigitalOcean are competitively priced starting at just $15/GB, the same as DigitalOcean’s Managed Database solution, but offer on average 30% more storage for the same price.
Some technical notes on our submission to the benchmark committee. Background For the past few months engineers from Nutanix have been participating in the MLPerftm Storagebenchmark which is designed to measure the storage performance required for ML training workloads. appeared first on n0derunner.
It starts with implementing data governance practices, which set standards and policies for data use and management in areas such as quality, security, compliance, storage, stewardship, and integration. Fragmented and siloed data storage can create inconsistencies and redundancies.
Dynatrace OneAgent deployment and life-cycle management are already widely considered to be industry benchmarks for reliability and efficiency. Easier rollout thanks to log storage best practices. Easier rollout thanks to log storage best practices. Dynatrace news. Advanced customization of OneAgent deployments made easy.
Our distributed tracing infrastructure is grouped into three sections: tracer library instrumentation, stream processing, and storage. An additional implication of a lenient sampling policy is the need for scalable stream processing and storage infrastructure fleets to handle increased data volume. Storage: don’t break the bank!
4:45pm-5:45pm NFX 209 File system as a service at Netflix Kishore Kasi , Senior Software Engineer Abstract : As Netflix grows in original content creation, its need for storage is also increasing at a rapid pace. In order to maintain performance, benchmarking is a vital part of our system’s lifecycle.
A Dedicated Log Volume (DLV) is a specialized storage volume designed to house database transaction logs separately from the volume containing the database tables. DLVs are particularly advantageous for databases with large allocated storage, high I/O per second (IOPS) requirements, or latency-sensitive workloads.
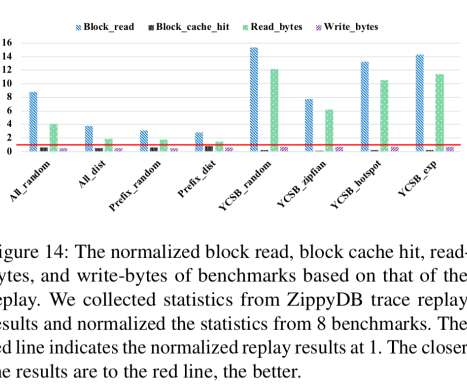
Characterizing, modeling, and benchmarking RocksDB key-value workloads at Facebook , Cao et al., Or in the case of key-value stores, what you benchmark. So if you want to design a system that will offer good real-world performance, it’s really useful to have benchmarks that accurately represent real-world workloads.
This service leverages Cassandra and Elasticsearch for data storage and retrieval. When onboarding embedding vector data we performed an extensive benchmarking to evaluate the available datastores. It can store and retrieve temporal (timestamp) as well as spatial (coordinates) data.
Querying the data While it is reasonable to create panels showing real-time load in order to explore better the types of queries that can be run against pg_stat_monitor, it is more practical to copy and query the data into tables after the benchmarking has completed its run. A script executing a benchmarking run: #!/bin/bash
With help from the Nutanix X-Ray team I have created an IO “benchmark” which simulates a “General Server Virtualization” workload. The post A Generalized workload generator for storage IO appeared first on n0derunner.
These have inspired me to summarize another performance activity: evaluating benchmark accuracy. Accurate benchmarking rewards engineering investment that actually improves performance, but, unfortunately, inaccurate benchmarking is more common. If the benchmark reported 20k ops/sec, you should ask: why not 40k ops/sec?
Storage The type of storage and disk used for database servers can have a significant impact on performance and reliability. Benchmark before you decide. Cloud Different cloud providers offer a range of instance types and sizes, each with varying amounts of CPU, memory, and storage. Transparent huge pages (THP) disabled.
xlarge 4vCPU 8GB-RAM Storage: EBS volume (root) 80GB gp2 (IOPS 240/3000) As well, high availability will be integrated, guaranteeing cluster viability in the case that one worker node goes down. And now, execute the benchmark: -- execute the following on the coordinator node pgbench -c 20 -j 3 -T 60 -P 3 pgbench The results are not pretty.
IT professionals are familiar with scoping the size of VMs with regards to vCPU, memory, and storage capacity. Storage optimized – High disk throughput and IO. and the overall size will determine the amount of temporary storage available. Premium storage support. VM Types and Sizes. VM Image Options. Generation.
In this video I migrate a Postgres DB running PGbench benchmark. As the DB continues to run on the new host – the Nutanix storage detects the access patterns and “localizes” the data that the DB is accessing. Many different queries are executing in parallel, some hitting RAM cache, some hitting storage.
4:45pm-5:45pm NFX 209 File system as a service at Netflix Kishore Kasi , Senior Software Engineer Abstract : As Netflix grows in original content creation, its need for storage is also increasing at a rapid pace. In order to maintain performance, benchmarking is a vital part of our system’s lifecycle.
4:45pm-5:45pm NFX 209 File system as a service at Netflix Kishore Kasi , Senior Software Engineer Abstract : As Netflix grows in original content creation, its need for storage is also increasing at a rapid pace. In order to maintain performance, benchmarking is a vital part of our system’s lifecycle.
These have inspired me to summarize another performance activity: evaluating benchmark accuracy. Accurate benchmarking rewards engineering investment that actually improves performance, but, unfortunately, inaccurate benchmarking is more common. If the benchmark reported 20k ops/sec, you should ask: why not 40k ops/sec?
Indexing efficiency Monitoring indexing efficiency in MySQL involves analyzing query performance, using EXPLAIN statements, utilizing performance monitoring tools, reviewing error logs, performing regular index maintenance, and benchmarking/testing. This KPI is also directly related to Query Performance and helps improve it.
This article will explore how they handle data storage and scalability, perform in different scenarios, and, most importantly, how these factors influence your choice. It uses a hash table to manage these pairs, divided into fixed-size buckets with linked lists for key-value storage. Redis Database Management with ScaleGrid ScaleGrid.io
Some opinions claim that “Benchmarks are meaningless”, “benchmarks are irrelevant” or “benchmarks are nothing like your real applications” However for others “Benchmarks matter,” as they “account for the processing architecture and speed, memory, storage subsystems and the database engine.”
This option is available in index properties to manage data storage in the data pages. Index Fill factor SQL Server Index Fill Factor is a percentage value to be filled data page with data in SQL Server. It […].
PMM2 uses VictoriaMetrics (VM) as its metrics storage engine. Please note that the focus of these tests was around standard metrics gathering and display, we’ll use a future blog post to benchmark some of the more intensive query analytics (QAN) performance numbers.
Why RPC is “faster” It’s tempting to simply write a micro-benchmark test where we issue 1000 requests to a server over HTTP and then repeat the same test with asynchronous messages. If you did such a benchmark, here’s an incomplete picture you might end up with: Graph of microbenchmark showing RPC is faster than messaging.
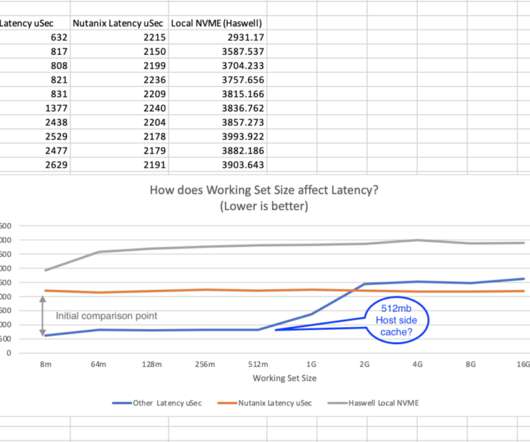
I was recently asked to investigate why Nutanix storage was not as fast as a competing solution in a PoC environment. One thing that seemed really odd was that the working set size for the tests were in the order of … The post Beware of tiny working-set-sizes when testing storage performance. appeared first on n0derunner.
use the TPC-H benchmark to assess Redshift, Redshift Spectrum, Athena, Presto, Hive, and Vertica to find out what works best and the trade-offs involved. For cost calculations, the costs are a combination of compute costs, storage costs, data scan costs, and software license costs. Key findings. System initialisation time.
To illustrate this, I ran the Sysbench-TPCC synthetic benchmark against two different GCP instances running a freshly installed Percona Server for MySQL version 8.0.31 In MySQL, considering the standard storage engine, InnoDB , the data cache is called Buffer Pool. In PostgreSQL, it is called shared buffers.
Storage is a critical aspect to consider when working with cloud workloads. High availability storage options within the context of cloud computing involve highly adaptable storage solutions specifically designed for storing vast amounts of data while providing easy access to it. What is an example of a workload?
Nutanix X-Ray is well known for being able to model IO/Storage workloads, but what about workloads that are CPU bound? For our purposes we are going to use Postgres DB and the built-in benchmarking tool PGbench. This time though the metric is Database transactions per second not IOPS or Storage throughput.
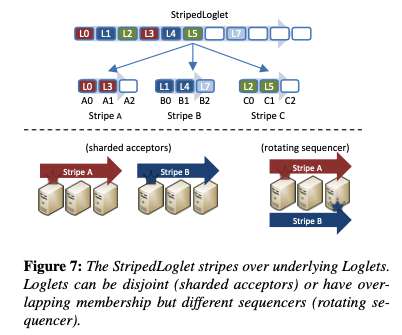
replacing Paxos with Raft), or they could be shims over external storage systems. A minimal Loglet needs to provide totally ordered, durable storage via the shared log API. The evaluation section has lots of good information on experiences running Delos in production, as well as some synthetic benchmarks. The NativeLoglet.
Self-managed databases come with their own set of expenses that must be factored in – managing a database requires time and effort which often includes backup storage, patching software upgrades as well as other typical administration tasks. Advantages of DBaaS Database management with DBaaS is like being on a luxury cruise.
Netflix engineers run a series of tests and benchmarks to validate the device across multiple dimensions including compatibility of the device with the Netflix SDK, device performance, audio-video playback quality, license handling, encryption and security. It could help us design and implement more targeted reward functions.
Key metrics like throughput, request latency, and memory utilization are essential for assessing Redis health, with tools like the MONITOR command and Redis-benchmark for latency and throughput analysis and MEMORY USAGE/STATS commands for evaluating memory. It depends upon your application workload and its business logic.
We organize all of the trending information in your field so you don't have to. Join 5,000+ users and stay up to date on the latest articles your peers are reading.
You know about us, now we want to get to know you!
Let's personalize your content
Let's get even more personalized
We recognize your account from another site in our network, please click 'Send Email' below to continue with verifying your account and setting a password.


Let's personalize your content