This site uses cookies to improve your experience. To help us insure we adhere to various privacy regulations, please select your country/region of residence. If you do not select a country, we will assume you are from the United States. Select your Cookie Settings or view our Privacy Policy and Terms of Use.
Cookie Settings
Cookies and similar technologies are used on this website for proper function of the website, for tracking performance analytics and for marketing purposes. We and some of our third-party providers may use cookie data for various purposes. Please review the cookie settings below and choose your preference.
Used for the proper function of the website
Used for monitoring website traffic and interactions
Cookie Settings
Cookies and similar technologies are used on this website for proper function of the website, for tracking performance analytics and for marketing purposes. We and some of our third-party providers may use cookie data for various purposes. Please review the cookie settings below and choose your preference.
Strictly Necessary: Used for the proper function of the website
Performance/Analytics: Used for monitoring website traffic and interactions
Over the years, I have watched and written about online retail and e-commerce IT performance. What I have seen is a maturing of the online retail channels when it comes to delivering customer experiences. This year we saw few, if any, major issues with online retailers. This is where many retailers have matured over the years.
Retail is one of the most important business domains for data science and data mining applications because of its prolific data and numerous optimization problems such as optimal prices, discounts, recommendations, and stock levels that can be solved using data analysis methods. However, many of these models are highly parametric (i.e.
For retail organizations, peak traffic can be a mixed blessing. Five-nines availability: The ultimate benchmark of system availability. The nightmare scenario for online retailers during peak periods, such as Black Friday and Cyber Monday, is a system crash. But is five nines availability attainable?
For example, a global retailer could leverage observability to track energy efficiency across its data centers. By embracing these strategies, the retailer could significantly reduce energy consumption and operational costs while fulfilling its environmental commitments.
Synthetic clickpath monitors are a great way to automatically monitor and benchmark business-critical workflows 24/7. Checking out of a retail site. Dynatrace news. Some common examples of such business-critical workflows include: Sign-up processes. Contact forms. Pricing calculators.
Today, many global industries implement FinOps, including telecommunications, retail, manufacturing, and energy conservation, as well as most Fortune 50 companies. Additionally, include benchmarks for stakeholders and best practices that support the anticipated growth of the organization as a whole. FinOps company culture.
And if that already wasn’t enough, the number of images on a page has been linked to lower conversion rates on retail sites. These numbers should NOT be taken as a benchmark for your own site. In other words, images comprised almost 60% of the total page weight. Learn how to optimize images. I'll go into this more below.
Retail: $20 trillion. Eli Bendersky : Just for fun, I rewrote the same benchmark in Go; two goroutines ping-ponging short message between themselves over a channel. They'll love you even more. Pflop/s : fully synchronous tensorflow data-parallel training; 3.3 Cars: $1 trillion.
Whether it be time, money, or technical know how, every day we talk to eCommerce and Retail teams who explain why they aren’t monitoring their site’s performance. Since our team is preparing for eTail West , there is no better time to address some of the common objections I’ve seen when talking to eCommerce and Retail teams about performance.
And if that already wasn’t enough, the number of images on a page has been linked to lower conversion rates on retail sites. These numbers should not be taken as a benchmark for your own site. You can see this by looking at the synthetic test result for Sears.com (again, available via our Industry Benchmarks ).
SpeedCurve's Industry Benchmarks dashboard – which tracks the performance of top sites in retail, media, travel, and other industries – is a good place to start. Here are the current US media benchmarks on a fast desktop connection , ranked by CLS score. Learn more about correlation charts here.).
Looking at the industry benchmarks for US retailers , four well-known sites have backend times that are approaching – or well beyond – that threshold. Pagespeed Benchmarks - US Retail - LCP When you examine a waterfall, it's pretty obvious that TTFB is the long pole in the tent, pushing out render times for the page.
We track LEGO.com, along with a handful of other leading ecommerce sites, in our public-facing RetailBenchmarks dashboard , which I encourage you to check out. Optimizing the critical rendering path could make this page a star on the RetailBenchmarks leaderboard. Those are already big wins.
Related: Web performance for retailers How to create correlation charts How to benchmark your site against your competitors How to set up real user monitoring (RUM) If you experiment with creating correlation charts and plotting the performance poverty line for your site, I'd love to hear about your results!
Your current competitive benchmarks status. Expanded Industry Speed Benchmarks. Page Speed Benchmarks is an interactive dashboard that lets you explore and compare web performance data for leading websites across several industries – from retail to media – over the past year. Lots of new videos!
Web Performance for Retailers. Industry speed benchmarks for Japan. We have a number of SpeedCurve users who want an ongoing understanding of how popular Japanese websites perform, so we added Japan to our Industry Page Speed Benchmarks dashboard. Performance Budgets 101. Performance Culture Best Practices. SpeedCurve recipes.
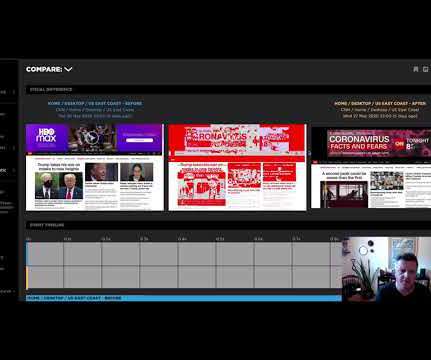
In this demo account, we track a number of leading retail, travel, and media sites. Benchmark yourself against your competitors. Now let's walk through how to run a comparison and analysis using a real-world example from our "Top Sites" demo account. I've randomly selected CNN for the purpose of this post. Related reading.
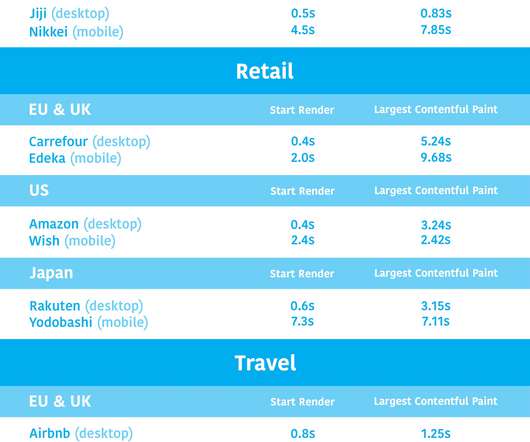
The easiest way to validate your metrics is to look at rendering filmstrips in your synthetic test data, like this: In the example above (taken from our Industry Benchmarks ) you can see: Start Render does correlate to content appearing in the viewport. Focus on key pages You don't need to apply performance budgets to all your pages.
And if that already wasn’t enough, the number of images on a page has been linked to lower conversion rates on retail sites. These numbers should not be taken as a benchmark for your own site. In other words, images comprised almost 75% of the total page weight. More on that later.) How quickly do they show up?
Related: Web performance for retailers How to create correlation charts How to benchmark your site against your competitors How to set up real user monitoring (RUM) If you experiment with creating correlation charts and plotting the performance plateau for your site, I'd love to hear about your results!
So far, we don't know the official base and turbo clock speeds, but there was a recent leak of partial specifications and pricing by a European retailer that listed max boost clock speeds of up to 3.4 I am optimistic that they will have higher single-threaded CPU performance than Intel Cascade Lake-SP processors.
Emily is the VP of Engineering for UGG, an American footwear and activewear retail company. As performance benchmarks go, 1.937 seconds is a significant delay in which the user could think your link or site is broken because it will not respond. Scenario: Through the Lens of Visual Metrics Alone. UGG First Interactive Time.
Emily is the VP of Engineering for UGG, an American footwear and activewear retail company. As performance benchmarks go, 1.937 seconds is a significant delay in which the user could think your link or site is broken because it will not respond. Scenario: Through the Lens of Visual Metrics Alone. UGG First Interactive Time.
What are some good sites I can use for benchmarking? Page Speed Benchmarks is an interactive dashboard that lets you explore and compare web performance data for leading websites across several industries – from retail to media. Identify sites you can use for your own competitive benchmarking. How awesome is that?!
With many synthetic monitoring tools, you can benchmark your site against your competitors. Competitive benchmarking is a great way to see how you stack up – and how much you need to improve. Page Speed Benchmarks is an interactive set of dashboards that anyone can explore and use for their own research.
Throughout this post I've used examples from our public Industry Benchmarks dashboard , which I'd encourage you to check out so that you can explore these metrics on your own. Here's a cheat sheet of metrics and goals (NOT performance budgets), based on broad benchmarks and Google's recommendations. Is it loading?
Take these statistics from Google’s industry benchmarks for mobile page speed guide: We’ve said it before but it’s worth reiterating that as web page load times increase, so does the likelihood of your visitors. According to Google, the best practice for a website’s speed is to keep it under 3 seconds load time.
Page Speed Benchmarks is an interactive dashboard that lets you explore and compare web performance data for leading websites across several industries – from retail to media – over the past year. Fastest Retail Sites. Create your own custom benchmark dashboard. United States. UK & EU. United States.
While Core Web Vitals are typically a big focus for retailers because they have a direct impact on search rank, they are not the only indicators of a good user experience. Benchmark your site against your competitors. But CrUX data is better than no RUM data. Set up reporting early Set up reports.
Author of the Pocket Guide to Web Performance and co-author of Using WebPageTest , Andy is an independent web performance consultant in the UK who has helped many leading retailers, newspapers and financial companies make their sites faster. He is a co-organizer of the London Web Performance meetup.
We organize all of the trending information in your field so you don't have to. Join 5,000+ users and stay up to date on the latest articles your peers are reading.
You know about us, now we want to get to know you!
Let's personalize your content
Let's get even more personalized
We recognize your account from another site in our network, please click 'Send Email' below to continue with verifying your account and setting a password.


Let's personalize your content