This site uses cookies to improve your experience. To help us insure we adhere to various privacy regulations, please select your country/region of residence. If you do not select a country, we will assume you are from the United States. Select your Cookie Settings or view our Privacy Policy and Terms of Use.
Cookie Settings
Cookies and similar technologies are used on this website for proper function of the website, for tracking performance analytics and for marketing purposes. We and some of our third-party providers may use cookie data for various purposes. Please review the cookie settings below and choose your preference.
Used for the proper function of the website
Used for monitoring website traffic and interactions
Cookie Settings
Cookies and similar technologies are used on this website for proper function of the website, for tracking performance analytics and for marketing purposes. We and some of our third-party providers may use cookie data for various purposes. Please review the cookie settings below and choose your preference.
Strictly Necessary: Used for the proper function of the website
Performance/Analytics: Used for monitoring website traffic and interactions
Building performant services and systems is at the core of every business. Tons of technologies emerge daily, promising capabilities that help you surpass your performance benchmarks. Growing organizations, in the process of upscaling their services, unintentionally introduce complexities into the system.
The nirvana state of system uptime at peak loads is known as “five-nines availability.” In its pursuit, IT teams hover over system performance dashboards hoping their preparations will deliver five nines—or even four nines—availability. How can IT teams deliver system availability under peak loads that will satisfy customers?
I have generally held the view that replicating data to a secondary system is faster than sync-ing to disk, assuming the round trip network delay wasn’t high due to quality networks and co-located redundant servers. This is the first time I have benchmarked it with a realistic example.
Introduction to Message Brokers Message brokers enable applications, services, and systems to communicate by acting as intermediaries between senders and receivers. This decoupling simplifies system architecture and supports scalability in distributed environments.
Performance Benchmarking of PostgreSQL on ScaleGrid vs. AWS RDS Using Sysbench This article evaluates PostgreSQL’s performance on ScaleGrid and AWS RDS, focusing on versions 13, 14, and 15. This study benchmarks PostgreSQL performance across two leading managed database platforms—ScaleGrid and AWS RDS—using versions 13, 14, and 15.
To function effectively, containers need to be able to communicate with each other and with network services. However, to be secure, containers must be properly isolated from each other and from the host system itself. Network scanners that see systems from the “outside” perspective. Network scanners.
IT infrastructure is the heart of your digital business and connects every area – physical and virtual servers, storage, databases, networks, cloud services. This shift requires infrastructure monitoring to ensure all your components work together across applications, operating systems, storage, servers, virtualization, and more.
They collect data from multiple sources through real user monitoring , synthetic monitoring, network monitoring, and application performance monitoring systems. This includes monitoring components such as web servers, databases, application performance interfaces (APIs), content delivery networks, and third-party integrations.
Software analytics offers the ability to gain and share insights from data emitted by software systems and related operational processes to develop higher-quality software faster while operating it efficiently and securely. It provides valuable insight into complex public, private, and hybrid cloud IT structures, systems, and frameworks.
4:45pm-5:45pm NFX 202 A day in the life of a Netflix Engineer Dave Hahn , SRE Engineering Manager Abstract : Netflix is a large, ever-changing ecosystem serving millions of customers across the globe through cloud-based systems and a globally distributed CDN. We explore all the systems necessary to make and stream content from Netflix.
Malicious attackers have gotten increasingly better at identifying vulnerabilities and launching zero-day attacks to exploit these weak points in IT systems. A zero-day exploit is a technique an attacker uses to take advantage of an organization’s vulnerability and gain access to its systems. half of all corporate networks.
The resulting outages wreaked havoc on customer experiences and left IT professionals scrambling to quickly find and repair affected systems. Dynatrace offers various out-of-the-box features and applications to provide a high-density overview of system health for all hosts and related metrics in a single view.
DORA seeks to strengthen the cybersecurity resilience of the EU’s banking and financial institutions by requiring them to possess the requisite processes, systems, and controls to prevent, manage, and recover from cybersecurity incidents. This helps assess the ability of systems and processes to withstand disruptions and recover quickly.
WAFs protect the network perimeter and monitor, filter, or block HTTP traffic. Compared to intrusion detection systems (IDS/IPS), WAFs are focused on the application traffic. For most enterprises, using a RASP solution would mean running multiple agents on their production systems, potentially creating risk due to incompatibilities.
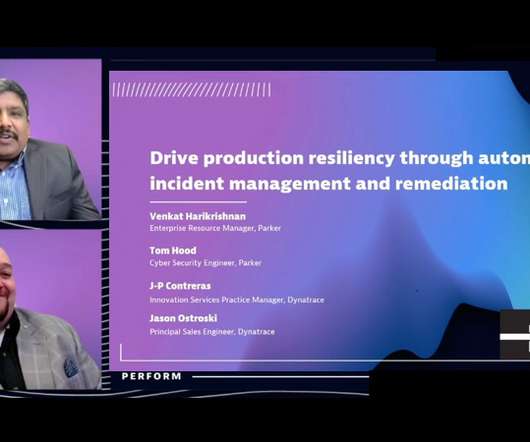
Like most IT professionals, Harikrishnan and the Parker team’s cybersecurity engineer Tom Hood have multiple requirements to manage, from implementing digital transformation and ensuring operational efficiency to securing IT systems. Unplanned system outages are costly, in both time and resources. Where is a user coming from?
which is difficult when troubleshooting distributed systems. Reconstructing a streaming session was a tedious and time consuming process that involved tracing all interactions (requests) between the Netflix app, our Content Delivery Network (CDN), and backend microservices.
Dynatrace OneAgent deployment and life-cycle management are already widely considered to be industry benchmarks for reliability and efficiency. The /opt directory is typically used for deployment of additional software running on the Unix system. You can also easily choose an existing network zone or host group. Dynatrace news.
Python is a popular programming language, especially for beginners, and consequently we see it occurring in places where it just shouldn’t be used, such as database benchmarking. We use stored procedures because, as the introductory post shows, using single SQL statements turns our database benchmark into a network test).
The scope of OSS ranges from small components, such as a Java class library, to complete systems, such as the Apache HTTP Server Project and the Kubernetes container management system. The trouble was extending tracing across distributed systems. Drives a culture of innovation. What are open standards? “We
However, not all user monitoring systems are created equal. In some cases, you will lack benchmarking capabilities. Synthetic monitoring is well suited for catching regressions during development lifecycles, especially with network throttling. What is real user monitoring? RUM generates a lot of data.
This allows for much better data accuracy, especially in the case of high-resolution or unreliable networks. A script executing a benchmarking run: #!/bin/bash Multi-Dimensional Grouping : While pg_stat_statements groups counters by userid, dbid, queryid, pg_stat_monitor uses a more detailed group for higher precision.
In this blog post, we will introduce speech and music detection as an enabling technology for a variety of audio applications in Film & TV, as well as introduce our speech and music activity detection (SMAD) system which we recently published as a journal article in EURASIP Journal on Audio, Speech, and Music Processing.
Oracle Database is a commercial, proprietary multi-model database management system produced by Oracle Corporation, and the largest relational database management system (RDBMS) in the world. Compare ease of use across compatibility, extensions, tuning, operating systems, languages and support providers. Compare Ease of Use.
Never inflict a distributed system on yourself unless you have too." JavaScript benchmark. seconds with the system. Hey, it's HighScalability time: @danielbryantuk : "A LAMP stack is a good thing. mipsytipsy #CloudNativeLondon. Do you like this sort of Stuff? Know anyone looking for a simple book explaining the cloud? . $2
Machine learning systems are stuck in a rut Barham & Isard, HotOS’19. In this paper we argue that systems for numerical computing are stuck in a local basin of performance and programmability. Challenges compiling non-standard kernels. GPU and TPU).
HammerDB uses stored procedures to achieve maximum throughput when benchmarking your database. HammerDB has always used stored procedures as a design decision because the original benchmark was implemented as close as possible to the example workload in the TPC-C specification that uses stored procedures. On MySQL, we saw a 1.5X
Beyond data and model parallelism for deep neural networks Jia et al., FlexFlow is evaluated over six real-world DNN benchmarks on two different GPU clusters. So it all sounds very promising, but there is one big catch: We found that existing deep learning systems (e.g. SysML’2019.
Netflix engineers run a series of tests and benchmarks to validate the device across multiple dimensions including compatibility of the device with the Netflix SDK, device performance, audio-video playback quality, license handling, encryption and security. The neural network (NN)-based agent uses a deep net with fully connected layers.
These have inspired me to summarize another performance activity: evaluating benchmark accuracy. Accurate benchmarking rewards engineering investment that actually improves performance, but, unfortunately, inaccurate benchmarking is more common. If the benchmark reported 20k ops/sec, you should ask: why not 40k ops/sec?
AWS High Performance XLarge (see system details below). No more network-based EBS, just blazing-fast local SSD. MySQL Performance Benchmark Configuration. MySQL on AWS Performance Test. Amazon RDS. Instance Type. DB Instance r4.xlarge xlarge (Multi-AZ). Deployment Type. 3 Node Master-Slave Set with Semisynchronous Replication.
Most publications have simply reported the benchmark improvement claims, but if you stop to think about them, the numbers dont make sense based on a simplistic view of the technology changes. So first thing to understand is that the benchmark skips a generation and compares product that differs over about a two year interval.
four petabytes : added to Internet Archive per year; 60,000 : patents donated by Microsoft to the Open Invention Network; 30 million : DuckDuckGo daily searches; 5 seconds : Google+ session length; 1 trillion : ARM device goal; $40B : Softbank investment in 5G; 30 : Happy Birthday IRC!; They'll love it and you'll be their hero forever.
million : new image/caption training set; 32,408,715 : queries sent to Pwned Passwords; 53% : Memory ICs Total 2018 Semi Capex; 11 : story Facebook datacenter prison in Singapore; $740,357 : ave cost of network downtime; Quotable Quotes: @BenedictEvans : Recorded music: $18 billion. They'll love you even more. Cars: $1 trillion.
4:45pm-5:45pm NFX 202 A day in the life of a Netflix Engineer Dave Hahn , SRE Engineering Manager Abstract : Netflix is a large, ever-changing ecosystem serving millions of customers across the globe through cloud-based systems and a globally distributed CDN. We explore all the systems necessary to make and stream content from Netflix.
4:45pm-5:45pm NFX 202 A day in the life of a Netflix Engineer Dave Hahn , SRE Engineering Manager Abstract : Netflix is a large, ever-changing ecosystem serving millions of customers across the globe through cloud-based systems and a globally distributed CDN. We explore all the systems necessary to make and stream content from Netflix.
These have inspired me to summarize another performance activity: evaluating benchmark accuracy. Accurate benchmarking rewards engineering investment that actually improves performance, but, unfortunately, inaccurate benchmarking is more common. If the benchmark reported 20k ops/sec, you should ask: why not 40k ops/sec?
Key metrics like throughput, request latency, and memory utilization are essential for assessing Redis health, with tools like the MONITOR command and Redis-benchmark for latency and throughput analysis and MEMORY USAGE/STATS commands for evaluating memory. It depends upon your application workload and its business logic.
The gotcha here is that, if your mobile experience isn’t optimized for various devices and network conditions, these customers will never appear in your analytics — just because your website or app will be barely usable on their devices, and so they are unlikely to return. A performance benchmark Lighthouse is well-known.
Indexing efficiency Monitoring indexing efficiency in MySQL involves analyzing query performance, using EXPLAIN statements, utilizing performance monitoring tools, reviewing error logs, performing regular index maintenance, and benchmarking/testing. This KPI is also directly related to Query Performance and helps improve it.
Defining high availability In general terms, high availability refers to the continuous operation of a system with little to no interruption to end users in the event of hardware or software failures, power outages, or other disruptions. Some disruption might occur, but it will be minimal. Fault tolerance aims for zero downtime and data loss.
Simply put, it’s the set of computational tasks that cloud systems perform, such as hosting databases, enabling collaboration tools, or running compute-intensive algorithms. Such demanding use cases place a great value on systems capable of fast and reliable execution, a need that spans across various industry segments.
An example of a flame graph can be found below: Each box is a function in the stack, and wider boxes mean more time the system was busy on CPU on these functions. Kubernetes limitations In Linux, by default, performance system events can’t be collected by unprivileged users.
The scope of OSS ranges from small components, such as a Java class library, to complete systems, such as the Apache HTTP Server Project and the Kubernetes container management system. The trouble was extending tracing across distributed systems. Drives a culture of innovation. What are open standards? “We
The scope of OSS ranges from small components, such as a Java class library, to complete systems, such as the Apache HTTP Server Project and the Kubernetes container management system. The trouble was extending tracing across distributed systems. Drives a culture of innovation. What are open standards? “We
We organize all of the trending information in your field so you don't have to. Join 5,000+ users and stay up to date on the latest articles your peers are reading.
You know about us, now we want to get to know you!
Let's personalize your content
Let's get even more personalized
We recognize your account from another site in our network, please click 'Send Email' below to continue with verifying your account and setting a password.


Let's personalize your content