This site uses cookies to improve your experience. To help us insure we adhere to various privacy regulations, please select your country/region of residence. If you do not select a country, we will assume you are from the United States. Select your Cookie Settings or view our Privacy Policy and Terms of Use.
Cookie Settings
Cookies and similar technologies are used on this website for proper function of the website, for tracking performance analytics and for marketing purposes. We and some of our third-party providers may use cookie data for various purposes. Please review the cookie settings below and choose your preference.
Used for the proper function of the website
Used for monitoring website traffic and interactions
Cookie Settings
Cookies and similar technologies are used on this website for proper function of the website, for tracking performance analytics and for marketing purposes. We and some of our third-party providers may use cookie data for various purposes. Please review the cookie settings below and choose your preference.
Strictly Necessary: Used for the proper function of the website
Performance/Analytics: Used for monitoring website traffic and interactions
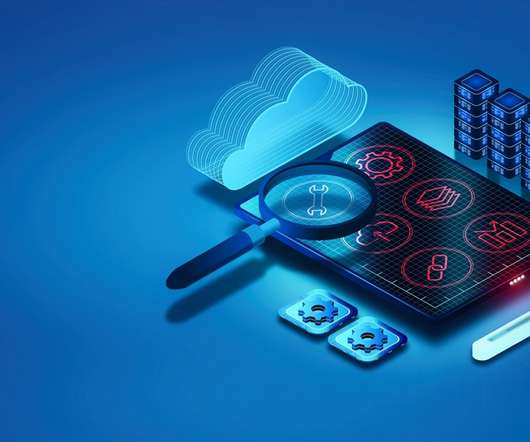
Manual approaches lack continuous monitoring, making them ill-equipped to prevent issues before they arise. Processes are time-intensive. Custom scripts and manual workflows demand substantial time and effort, creating inefficiencies. Reactivity. The skills gap creates inefficiencies.
Digital experience monitoring (DEM) is crucial for organizations to meet this demand and succeed in today’s competitive digital economy. DEM solutions monitor and analyze the quality of digital experiences for users across digital channels. The time taken to complete the page load.
As businesses compete for customer loyalty, it’s critical to understand the difference between real-user monitoring and synthetic user monitoring. However, not all user monitoring systems are created equal. What is real user monitoring? Real-time monitoring of user application and service interactions.
Dynatrace Synthetic Monitoring allows you to proactively monitor the availability of your public as well as your internal web applications and API endpoints from locations around the globe or important internal locations such as branch offices. Synthetic monitors help you find issues before they affect your customers.
This shift requires infrastructure monitoring to ensure all your components work together across applications, operating systems, storage, servers, virtualization, and more. What is infrastructure monitoring? . What to look for when selecting an infrastructure monitoring solution?
Synthetic clickpath monitors are a great way to automatically monitor and benchmark business-critical workflows 24/7. This is why we introduced JavaScript events to our Synthetic monitor scripts a couple of months ago. Synthetic Monitoring improvements for dynamic environments. Dynatrace news. Contact forms.
Tons of technologies emerge daily, promising capabilities that help you surpass your performance benchmarks. However, production environments are chaotic landscapes that exact a heavy performance toll when not maintained and monitored. Building performant services and systems is at the core of every business.
This has led to the recent release of our new Lambda monitoring extension supporting Node.js, Java, and Python. This extension was built from scratch to take into account all we’ve learned and the special requirements for monitoring ephemeral, auto-scaling, micro VMs like AWS Lambda. A look under the hood of AWS Lambda.
RabbitMQ can be deployed in distributed environments and includes monitoring tools through a built-in dashboard and CLI. Performance and Benchmark Comparison When comparing RabbitMQ and Kafka, performance factors such as throughput, latency, and scalability play a critical role.
Instead, they can ensure that services comport with the pre-established benchmarks. In what follows, we explore some of these best practices and guidance for implementing service-level objectives in your monitored environment. To measure availability, we can rely on an HTTP monitor from Dynatrace Synthetic Monitoring.
How To Benchmark And Improve Web Vitals With Real User Metrics. How To Benchmark And Improve Web Vitals With Real User Metrics. Different products will have different benchmarks and two apps may perform differently against the same metrics, but still rank quite similarly to our subjective “good” and “bad” verdicts.
Document and benchmark existing applications, processes, and services. Monitor and measure progress during the migration. Once a modernization plan is in place, strategize how to monitor and measure the process. Then, set realistic KPIs underlying application modernization efforts.
Quality gates are benchmarks in the software delivery lifecycle that define specific, measurable, and achievable success criteria a service must meet before moving to the next phase of the software delivery pipeline. Enforcing benchmarks in real time. What are quality gates?
Monitor post-release validation: Validation monitoring is not yet finished, even after fixes. It is essential to monitor all changes upon completing the release validation. Post-release validation monitoring will help developers understand any new issues and whether validation corrections positively impact the latest release.
You will need to know which monitoring metrics for Redis to watch and a tool to monitor these critical server metrics to ensure its health. This blog post lists the important database metrics to monitor. Effective monitoring of key performance indicators plays a crucial role in maintaining this optimal speed of operation.
Dynatrace monitors IT front-ends and provides insight into issues, such as mobile application crashes — with in-depth analysis of what went wrong, when, and most importantly, why. First, the company uses synthetic monitoring to develop user experience benchmarks and determine if applications are performing within expected thresholds.
Real-time monitoring with out-of-the-box features Real-time data and monitoring are crucial for maintaining situational awareness of IT environment stability and performance, especially during a crisis. They also enable companies to measure the effectiveness of their remediation activities to ensure that recoveries proceed as expected.
Many good security tools provide that function, and benchmarks from the Center for Internet Security (CIS) are clear and prescriptive. Use scripts to configure hosts properly based on the CIS benchmarks. Why is container security tricky? Harden the host operating system. Remove privileges. The best of all worlds.
However, as an internal benchmark, there are compelling reasons why some of you may actually want to keep tracking these ‘outdated’ metrics… Measure the User Experience The problem with using diagnostic metrics like Load or DOMContentLoaded to measure site-speed is that it has no bearing on how a user might actually experience your site.
Application performance monitoring (APM) solutions have evolved in recent years, and organizations now have plenty of options to choose from when selecting the right tools for their needs. APM solutions track key software application performance metrics using monitoring software and telemetry data. Dynatrace news.
Additionally, ScaleGrid offers several competitive advantages such as full superuser access, custom master-slave configurations, and advanced slow query analysis and monitoring capabilities through their sophisticated platform.
Nonetheless, to help mitigate climate change, it’s critically important for organizations to measure, monitor, and reduce their IT carbon footprints. The Carbon Impact app assesses carbon emissions and energy consumption from all monitored hosts. Certainly, this is true for us. That’s why we developed Carbon Impact.
Techniques such as statistics-based monitoring and behavior-based monitoring are also possible. Statistics-based monitoring is when organizations take statistics from exploits that vendors have detected and feed them into a system to learn and identify these attacks. Application logs are a good data source for this method.
Service-level objectives (SLOs) are key to the SRE role; they are agreed-upon performance benchmarks that represent the health of an application or service. SREs need SLOs to measure and monitor performance, but many organizations lack the automation and intelligence to streamline data.
Python is a popular programming language, especially for beginners, and consequently we see it occurring in places where it just shouldn’t be used, such as database benchmarking. We use stored procedures because, as the introductory post shows, using single SQL statements turns our database benchmark into a network test).
Five-nines availability: The ultimate benchmark of system availability. Integrate infrastructure monitoring on a single AIOps platform. Because modern IT architectures consist of traditional and cloud-native technologies, organizations also use specialized monitoring tools tailored for specific uses. Automate IT operations.
In consideration of this reality, The Dynatrace Lambda monitoring extension supports all well-known IaC technologies to deploy Dynatrace along with your function. Today, Lambda can be monitored by Dynatrace in hybrid environments, thereby satisfying the enterprise requirements. This is where monitoring requirements come into play.
2022 was an exciting year for Percona Monitoring and Management (PMM). Planning for resources of a PMM Server host instance can be tricky because the numbers can change depending on the DB instances being monitored by PMM. We’ve added and improved many features, including Alerting and Backup Management.
In consideration of this reality, The Dynatrace Lambda monitoring extension supports all well-known IaC technologies to deploy Dynatrace along with your function. Today, Lambda can be monitored by Dynatrace in hybrid environments, thereby satisfying the enterprise requirements. This is where monitoring requirements come into play.
Security should be an integral part of each stage of the software delivery lifecycle, from development to monitoring in real time. Monitor the application before, during, and after migration Migrating and changing code can be a tricky business. Use SLAs, SLOs, and SLIs as performance benchmarks for newly migrated microservices.
In the experience of Dynatrace customers, continuously monitoring, identifying, and addressing exposures—along with implementing more precise protection from exploit attempts—is crucial for maintaining a resilient IT environment. Continuously monitor runtime environments for exposures and assess their scope and potential impact.
Continuously monitoring your runtime environments for vulnerabilities will also reveal security issues that may have only shown themselves during production. Organizations should have a tool that continuously monitors applications, as well as identifies and blocks common application attacks and malicious activity automatically.
The core benefits of an AIOps-automated software analytics platform include the following: Infrastructure monitoring. Applications and microservices monitoring. Additionally, software analytics enhances the digital customer experience by enabling faster service for high-quality offerings.
Social media was relatively quiet, and as always, the Dynatrace Insights team was benchmarking key retailer home pages from mobile and desktop perspectives. Dynatrace RUM (Real User Monitoring) has a session replay capability that allows you to see what an end user would see during a session in real time.
In this talk, we share how Netflix deploys systems to meet its demands, Ceph’s design for high availability, and results from our benchmarking. In order to maintain performance, benchmarking is a vital part of our system’s lifecycle. This session looks at what it takes to accept, produce, encode, and stream your favorite content.
Dynatrace OneAgent deployment and life-cycle management are already widely considered to be industry benchmarks for reliability and efficiency. Deployment performs the whole rollout, instrumentation, configuration, connection, and automatic detection of monitored entities in your environment.
Getting started with Digital Experience Monitoring (DEM) analytics. You’ll learn how to understand application usage patterns, infrastructure consumption, service dependencies, benchmarking performance and ensuring service levels, and enabling modern operations. Learn how to understand your true user experience for your end-users.
That’s why organizations like Parker Hannifin need to be able to proactively monitor incidents before they escalate into outages. Once monitoring began, Dynatrace provided early-warning signals of a potential outage on customer-facing digital assets. Here’s how they did it. But they didn’t trust the results at first.
Additionally, teams should perform continuous audits to evaluate data against benchmarks and implement best practices for ensuring data quality. Unleash the power of causal AI Dynatrace provides an AI-powered, automated IT performance monitoring platform with advanced observability and analytics capabilities.
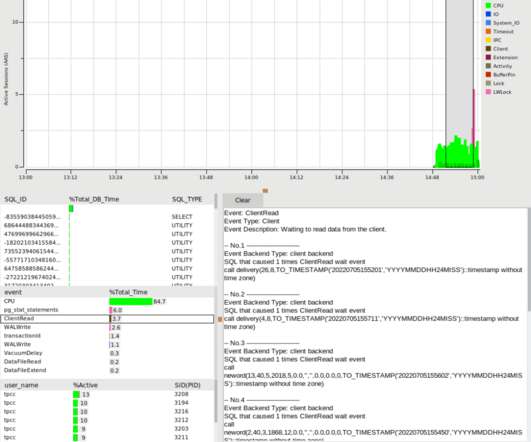
Configuring Grafana For our purposes, the Grafana datasource used in this PoC is also the Postgres data cluster that is generating the data to be monitored. pg_stat_monitor About pg_stat_monitor is a Query Performance Monitoring tool for PostgreSQL. A script executing a benchmarking run: #!/bin/bash
By Jose Fernandez Today, we are thrilled to announce the release of bpftop , a command-line tool designed to streamline the performance optimization and monitoring of eBPF applications. As Netflix increasingly adopts eBPF [ 1 , 2 ], applying the same rigor to these applications as we do to other managed services is imperative.
To deliver outstanding customer experience for your applications and websites, you need reliable benchmarks that measure what good customer experience looks like. Dynatrace is the only solution that provides these user experience metrics consistently for real user monitoring as well as for synthetic monitors. Dynatrace news.
WAFs protect the network perimeter and monitor, filter, or block HTTP traffic. A perfect OWASP benchmark score for injection attacks – 100% accuracy and zero false positives – impressively proves the precision of our approach. Compared to intrusion detection systems (IDS/IPS), WAFs are focused on the application traffic.
Additionally, include benchmarks for stakeholders and best practices that support the anticipated growth of the organization as a whole. Adopting observability and monitoring tools can effectively detect and eliminate unused resources to prevent waste. FinOps company culture.
We organize all of the trending information in your field so you don't have to. Join 5,000+ users and stay up to date on the latest articles your peers are reading.
You know about us, now we want to get to know you!
Let's personalize your content
Let's get even more personalized
We recognize your account from another site in our network, please click 'Send Email' below to continue with verifying your account and setting a password.


Let's personalize your content