This site uses cookies to improve your experience. To help us insure we adhere to various privacy regulations, please select your country/region of residence. If you do not select a country, we will assume you are from the United States. Select your Cookie Settings or view our Privacy Policy and Terms of Use.
Cookie Settings
Cookies and similar technologies are used on this website for proper function of the website, for tracking performance analytics and for marketing purposes. We and some of our third-party providers may use cookie data for various purposes. Please review the cookie settings below and choose your preference.
Used for the proper function of the website
Used for monitoring website traffic and interactions
Cookie Settings
Cookies and similar technologies are used on this website for proper function of the website, for tracking performance analytics and for marketing purposes. We and some of our third-party providers may use cookie data for various purposes. Please review the cookie settings below and choose your preference.
Strictly Necessary: Used for the proper function of the website
Performance/Analytics: Used for monitoring website traffic and interactions
Dynatrace Synthetic Monitoring allows you to proactively monitor the availability of your public as well as your internal web applications and API endpoints from locations around the globe or important internal locations such as branch offices. Synthetic monitors help you find issues before they affect your customers.
Digital experience monitoring (DEM) is crucial for organizations to meet this demand and succeed in today’s competitive digital economy. DEM solutions monitor and analyze the quality of digital experiences for users across digital channels.
As businesses compete for customer loyalty, it’s critical to understand the difference between real-user monitoring and synthetic user monitoring. However, not all user monitoring systems are created equal. What is real user monitoring? RUM gathers information on a variety of performance metrics.
This has led to the recent release of our new Lambda monitoring extension supporting Node.js, Java, and Python. This extension was built from scratch to take into account all we’ve learned and the special requirements for monitoring ephemeral, auto-scaling, micro VMs like AWS Lambda. A look under the hood of AWS Lambda.
By implementing service-level objectives, teams can avoid collecting and checking a huge amount of metrics for each service. Instead, they can ensure that services comport with the pre-established benchmarks. This process includes benchmarking realistic SLO targets based on statistical and probabilistic analysis from Dynatrace.
How To Benchmark And Improve Web Vitals With Real User Metrics. How To Benchmark And Improve Web Vitals With Real User Metrics. Web performance is a broad topic with thousands of metrics that you could potentially monitor and improve. Chrome User Experience Report vs Real User Metrics. Átila Fassina.
This shift requires infrastructure monitoring to ensure all your components work together across applications, operating systems, storage, servers, virtualization, and more. What is infrastructure monitoring? . What to look for when selecting an infrastructure monitoring solution?
RabbitMQ can be deployed in distributed environments and includes monitoring tools through a built-in dashboard and CLI. Performance and Benchmark Comparison When comparing RabbitMQ and Kafka, performance factors such as throughput, latency, and scalability play a critical role.
You will need to know which monitoringmetrics for Redis to watch and a tool to monitor these critical server metrics to ensure its health. Redis returns a big list of database metrics when you run the info command on the Redis shell. You can pick a smart selection of relevant metrics from these.
To deliver outstanding customer experience for your applications and websites, you need reliable benchmarks that measure what good customer experience looks like. Dynatrace Visually complete is a point-in-time web performance metric that measures when the visual area of a page has finished loading. Dynatrace news. What you can achieve.
I never thought I’d write an article in defence of DOMContentLoaded , but here it is… For many, many years now, performance engineers have been making a concerted effort to move away from technical metrics such as Load , and toward more user-facing, UX metrics such as Speed Index or Largest Contentful Paint. Or are they…?
Document and benchmark existing applications, processes, and services. Monitor and measure progress during the migration. Once a modernization plan is in place, strategize how to monitor and measure the process. It’s important to create a baseline of metrics in an application modernization strategy.
Application performance monitoring (APM) solutions have evolved in recent years, and organizations now have plenty of options to choose from when selecting the right tools for their needs. APM solutions track key software application performance metrics using monitoring software and telemetry data. Dynatrace news.
65% of businesses report that 40% of their customers now engage with them through mobile devices , and 70% of digital businesses will require IT and Ops to report digital metrics by 2025. .” How DEM helps drive end user experiences for better business outcomes. ” These answers are now critical for business success. DEM in action.
Real-time monitoring with out-of-the-box features Real-time data and monitoring are crucial for maintaining situational awareness of IT environment stability and performance, especially during a crisis. They also enable companies to measure the effectiveness of their remediation activities to ensure that recoveries proceed as expected.
Nonetheless, to help mitigate climate change, it’s critically important for organizations to measure, monitor, and reduce their IT carbon footprints. The Carbon Impact app assesses carbon emissions and energy consumption from all monitored hosts. These metrics include CPU, memory, disk, and network I/O.
Quality gates are benchmarks in the software delivery lifecycle that define specific, measurable, and achievable success criteria a service must meet before moving to the next phase of the software delivery pipeline. Enforcing benchmarks in real time. What are quality gates?
Service-level objectives (SLOs) are key to the SRE role; they are agreed-upon performance benchmarks that represent the health of an application or service. SREs need SLOs to measure and monitor performance, but many organizations lack the automation and intelligence to streamline data.
End-to-end observability starts with tracking logs, metrics, and traces of all the components, providing a better understanding of service relationships and application dependencies. Security should be an integral part of each stage of the software delivery lifecycle, from development to monitoring in real time.
In AIOps , this means providing the model with the full range of logs, events, metrics, and traces needed to understand the inner workings of a complex system. Additionally, teams should perform continuous audits to evaluate data against benchmarks and implement best practices for ensuring data quality.
Many good security tools provide that function, and benchmarks from the Center for Internet Security (CIS) are clear and prescriptive. Use scripts to configure hosts properly based on the CIS benchmarks. Why is container security tricky? Harden the host operating system. Remove privileges. The best of all worlds.
Five-nines availability: The ultimate benchmark of system availability. Include metrics, event logs, distributed traces, metadata, user experience data, and telemetry data from open source technologies and cloud platforms. Integrate infrastructure monitoring on a single AIOps platform. But is five nines availability attainable?
2022 was an exciting year for Percona Monitoring and Management (PMM). PMM2 uses VictoriaMetrics (VM) as its metrics storage engine. Planning for resources of a PMM Server host instance can be tricky because the numbers can change depending on the DB instances being monitored by PMM. We have tested PMM version 2.33.0
Get hands-on experience installing the OneAgent, understanding the full-stack metrics captured, and reviewing key use cases covered by the platform. Getting started with Digital Experience Monitoring (DEM) analytics. Learn how to understand your true user experience for your end-users.
This PoC demonstrates how to install and configure pg_stat_monitor in order to extract useful and actionable metrics from a PostgreSQL database and display them on a Grafana dashboard. Configuring Grafana For our purposes, the Grafana datasource used in this PoC is also the Postgres data cluster that is generating the data to be monitored.
It’s true that what might be considered the “most important” or “best” web performance metrics can vary by industry. These six metrics were not chosen at random – they work together to give you a snapshot of your site’s performance and overall user experience so you can set a baseline and improve speed and usability. Speed Index.
In this session, we discuss the technologies used to run a global streaming company, growing at scale, billions of metrics, benefits of chaos in production, and how culture affects your velocity and uptime. In order to maintain performance, benchmarking is a vital part of our system’s lifecycle. Thursday?—?December
Additionally, include benchmarks for stakeholders and best practices that support the anticipated growth of the organization as a whole. Establish a FinOps culture that supports buy-in from all stakeholders, as well as metrics that all teams understand and use. FinOps company culture. FinOps behavioral change management.
Weve seen this across dozens of companies, and the teams that break out of this trap all adopt some version of Evaluation-Driven Development (EDD), where testing, monitoring, and evaluation drive every decision from the start. Why early observability (logging and monitoring) is crucial for diagnosing issues. How do we do so?
A monitoring tool like Percona Monitoring and Management (PMM) is a popular choice among open source options for effectively monitoring MySQL performance. In this blog, we will explore various MySQL KPIs that are basic and essential to track using monitoring tools like PMM.
How does page bloat affect other metrics, such as Google's Core Web Vitals? These numbers should not be taken as a benchmark for your own site. Google's Core Web Vitals are a set of metrics that are intended to focus on measuring performance from a user-experience perspective. How does page bloat hurt your business?
Additionally, it became easy to provide deep links to different monitoring and deployment systems in Edgar due to consistent tagging. In 2019 our stunning colleagues in the Cloud Database Engineering (CDE) team benchmarked EBS performance for our use case and migrated existing clusters to use EBS Elastic volumes.
In the past, the answer would be based on the load time of a page, but over the years, we have evolved our approach to site speed to incorporate new metrics, alone or in combination with existing metrics. The next evolution of performance brought in paint metrics. This is where so-called interactivity metrics come in.
Introducing the PostgreSQL performance metrics viewer. HammerDB included a graphical performance metrics view for the Oracle database only. HammerDB includes the same functionality for PostgreSQL enabling the user to drill down on database metrics in real time. PostgreSQL Graphical Metrics. PostgreSQL Metrics treeview.
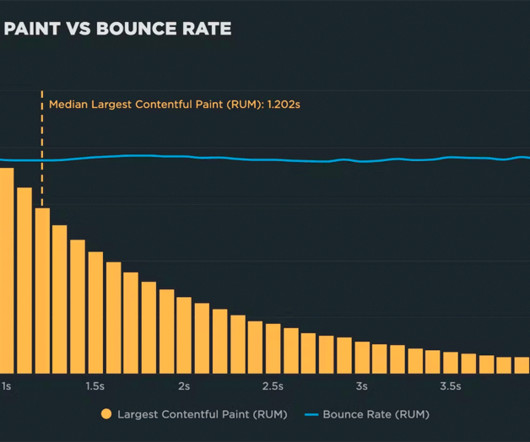
"I made my pages faster, but my business and user engagement metrics didn't change. The performance poverty line is the plateau at which changes to your website’s rendering metrics (such as Start Render and Largest Contentful Paint) cease to matter because you’ve bottomed out in terms of business and user engagement metrics.
To illustrate this, I ran the Sysbench-TPCC synthetic benchmark against two different GCP instances running a freshly installed Percona Server for MySQL version 8.0.31 To illustrate this, I ran the Sysbench-TPCC synthetic benchmark against two different GCP instances running a freshly installed Percona Server for MySQL version 8.0.31
you can now do that with Oracle Metrics. . To get started with Oracle metrics use the previous option for CPU metrics that now shows the service name and system user and password. To get started with Oracle metrics use the previous option for CPU metrics that now shows the service name and system user and password.
Similar to our article Average Page Load Times for 2018 , we’ll go over the averages for metrics and help you determine if your site is faster or slower than average. As you know, there are many metrics that determine a website’s page speed, and we can’t look at just one of them to determine how performant our site is.
Back in May, we shared that SpeedCurve supports Google's Core Web Vitals in both our synthetic monitoring and LUX real user monitoring tools. The newcomer to the scene was Cumulative Layout Shift (CLS), and, not surprisingly, it's the metric that's gotten the most questions. How is it calculated? What does CLS measure?
In this session, we discuss the technologies used to run a global streaming company, growing at scale, billions of metrics, benefits of chaos in production, and how culture affects your velocity and uptime. In order to maintain performance, benchmarking is a vital part of our system’s lifecycle. Thursday?—?December
In this session, we discuss the technologies used to run a global streaming company, growing at scale, billions of metrics, benefits of chaos in production, and how culture affects your velocity and uptime. In order to maintain performance, benchmarking is a vital part of our system’s lifecycle. Thursday?—?December
The best way to fight regressions is to create performance budgets on key metrics, and get alerted when they go out of bounds. These charts let even the most non-technical stakeholder easily see the correlation between performance and user engagement and business metrics, such as bounce rate and conversion rate.
A performance budget is a threshold that you apply to the metrics you care about the most. A performance budget is a threshold that you apply to the metrics you care about the most. Which metrics should you start with? With hundreds of potential performance metrics to track, this is a huge question. Let's get started!
Page speed has been a key factor in Google’s ranking algorithm since 2010 , so it is essential to understand the various ways you can optimize your pages and why implementing synthetic monitoring can ensure your pages perform flawlessly and revenue isn’t lost. Synthetic Monitoring: Continuous Website Performance Monitoring.
We organize all of the trending information in your field so you don't have to. Join 5,000+ users and stay up to date on the latest articles your peers are reading.
You know about us, now we want to get to know you!
Let's personalize your content
Let's get even more personalized
We recognize your account from another site in our network, please click 'Send Email' below to continue with verifying your account and setting a password.


Let's personalize your content