This site uses cookies to improve your experience. To help us insure we adhere to various privacy regulations, please select your country/region of residence. If you do not select a country, we will assume you are from the United States. Select your Cookie Settings or view our Privacy Policy and Terms of Use.
Cookie Settings
Cookies and similar technologies are used on this website for proper function of the website, for tracking performance analytics and for marketing purposes. We and some of our third-party providers may use cookie data for various purposes. Please review the cookie settings below and choose your preference.
Used for the proper function of the website
Used for monitoring website traffic and interactions
Cookie Settings
Cookies and similar technologies are used on this website for proper function of the website, for tracking performance analytics and for marketing purposes. We and some of our third-party providers may use cookie data for various purposes. Please review the cookie settings below and choose your preference.
Strictly Necessary: Used for the proper function of the website
Performance/Analytics: Used for monitoring website traffic and interactions
Kafka clusters can be deployed in Kubernetes using Helm charts to simplify scaling and management across multiple servers. Several factors impact RabbitMQs responsiveness, including hardware specifications, network speed, available memory, and queue configurations. RabbitMQ ensures fast message delivery when queues are not overloaded.
Because monolithic applications combine database, client-side interfaces, and server-side application elements in a single executable, they’re difficult to understand, even for their own administrators. Use SLAs, SLOs, and SLIs as performance benchmarks for newly migrated microservices.
Hardware Memory The amount of RAM to be provisioned for database servers can vary greatly depending on the size of the database and the specific requirements of the company. Some servers may need a few GBs of RAM, while others may need hundreds of GBs or even terabytes of RAM. Benchmark before you decide.
One initial, easy step to moving your SQL Server on-premises workloads to the cloud is using Azure VMs to run your SQL Server workloads in an infrastructure as a service (IaaS) scenario. You will still have to maintain your operating system, SQL Server and databases just like you would in an on-premises scenario.
On MySQL and Percona Server for MySQL , there is a schema called information_schema (I_S) which provides information about database tables, views, indexes, and more. Disclaimer : This blog post is meant to show a less-known problem but is not meant to be a serious benchmark. Results for Percona Server for MySQL 5.7
PostgreSQL Cluster One coordinator node citus-coord-01 Three worker nodes citus1 citus2 citus3 Hardware AWS Instance Ubuntu Server 20.04, SSD volume type 64-bit (x86) c5.xlarge And now, execute the benchmark: -- execute the following on the coordinator node pgbench -c 20 -j 3 -T 60 -P 3 pgbench The results are not pretty.
Defining high availability In general terms, high availability refers to the continuous operation of a system with little to no interruption to end users in the event of hardware or software failures, power outages, or other disruptions. Load balancers can detect when a component is not responding and put traffic redirection in motion.
HammerDB uses stored procedures to achieve maximum throughput when benchmarking your database. HammerDB has always used stored procedures as a design decision because the original benchmark was implemented as close as possible to the example workload in the TPC-C specification that uses stored procedures. On MySQL, we saw a 1.5X
As a MySQL database administrator, keeping a close eye on the performance of your MySQL server is crucial to ensure optimal database operations. However, simply deploying a monitoring tool is not enough; you need to know which Key Performance Indicators (KPIs) to monitor to gain insights into your MySQL server’s health and performance.
You will need to know which monitoring metrics for Redis to watch and a tool to monitor these critical server metrics to ensure its health. Connected_slaves provides information about replication status while Used_memory tracks utilized amount of server’s total capacity. You can pick a smart selection of relevant metrics from these.
Most publications have simply reported the benchmark improvement claims, but if you stop to think about them, the numbers dont make sense based on a simplistic view of the technology changes. So first thing to understand is that the benchmark skips a generation and compares product that differs over about a two year interval.
The $47,500 licensing costs for Oracle Enterprise Edition is only for one CPU core, that ultimately has to be multiplied with the actual number of cores on the physical server. Oracle support for hardware and software packages is typically available at 22% of their licensing fees. . $104,310. So Which Is Best?
In the digital age, data management has transformed from locally hosted servers to cloud solutions. These databases require significant time commitment along with necessary technical skills plus hardware & software costs, all of which are without dedicated team assistance. These advantages come at an expense.
Some of the most important elements include: No single point of failure (SPOF): You must eliminate any SPOF in the database environment, including any potential for an SPOF in physical or virtual hardware. Load balancing: Traffic is distributed across multiple servers to prevent any one component from becoming overloaded.
On August 7, 2019, AMD finally unveiled their new 7nm EPYC 7002 Series of server processors, formerly code-named "Rome" at the AMD EPYC Horizon Event in San Francisco. This is the second generation EPYC server processor that uses the same Zen 2 architecture as the AMD Ryzen 3000 Series desktop processors.
As part of our new support for ARM processors , we recently ran benchmarks on both Intel C7 and ARM c7g on AWS. The goal of these benchmarks was to both quantify performance differences between the two platforms and gain an understanding of their TCO. We used an in-house benchmark called voltdb-charglt.
Some opinions claim that “Benchmarks are meaningless”, “benchmarks are irrelevant” or “benchmarks are nothing like your real applications” However for others “Benchmarks matter,” as they “account for the processing architecture and speed, memory, storage subsystems and the database engine.”
Because recognizing if the workload is read intensive or write intensive will impact your hardware choices, database configuration as well as what techniques you can apply for performance optimization and scalability. Let’s examine the TPC-C Benchmark from this point of view, or more specifically its implementation in Sysbench.
It was also a virtual machine that lacked low-level hardware profiling capabilities, so I wasn't able to do cycle analysis to confirm that the 10% was entirely frame pointer-based. Back-end servers. and we may have been flying close to the edge of hardware cache warmth, where adding a bit more instructions caused a big drop.
HammerDB is a load testing and benchmarking application for relational databases. However, it is crucial that the benchmarking application does not have inherent bottlenecks that artificially limits the scalability of the database. Basic Benchmarking Concepts. To benchmark a database we introduce the concept of a Virtual User.
HammerDB is a software application for database benchmarking. It enables the user to measure database performance and make comparative judgements about database hardware and software. Databases are highly sophisticated software, and to design and run a fair benchmark workload is a complex undertaking. Supported Databases.
When we released Always On Availability Groups in SQL Server 2012 as a new and powerful way to achieve high availability, hardware environments included NUMA machines with low-end multi-core processors and SATA and SAN drives for storage (some SSDs). As we moved towards SQL Server 2014, the pace of hardware accelerated.
There are a couple of blog posts from Yves that describe and benchmark MySQL compression: Compression Options in MySQL (Part 1) Compression Options in MySQL (Part 2) Archive or purge old or non-used data: Some companies have to retain data for multiple years either for compliance or for business requirements.
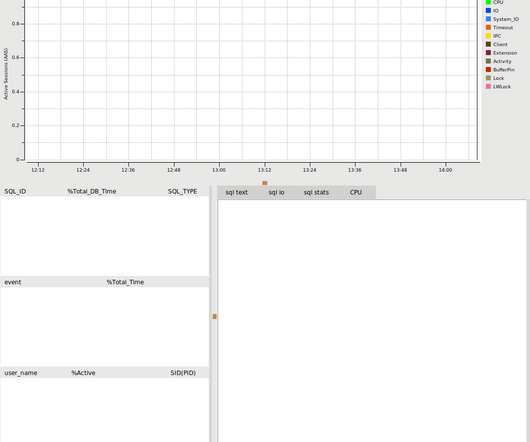
This enables the user to compare and contrast performance across different benchmark scenarios. include/server -I/opt/postgresql-14.1/include/internal Metrics view for benchmark. When a benchmark workload has completed, use the selection tool in the graph to select the metrics for a period of time of interest.
This server is spending about a third of its CPU cycles just checking the time! As a Xen guest, this profile was gathered using perf(1) and the kernel's software cpu-clock soft interrupts, not the hardware NMI. 30.14% in the middle of the flame graph. Searching shows it was elsewhere as well for a total of 32.1%.
Microsoft SQL Server I/O Basics Author: Bob Dorr, Microsoft SQL Server Escalation Published: December, 2004 SUMMARY: Learn the I/O requirements for Microsoft SQL Server database file operations. This will help you increase system performance and avoid I/O environment errors.
GHz 4th Generation Intel Xeon Scalable processors (code-named Sapphire Rapids) Up to 20% higher compute performance than z1d instances Up to 50 Gbps of networking speed Up to 40 Gbps of bandwidth to the Amazon Elastic Block Store (EBS) We can also verify these capabilities by running some simple benchmarks on the different subsystems.
HOW IT WORKS: SQL Server Scheduler Affinity SQL Server uses 3 types of affinity to control where the SQL Server worker threads execute. Node Types SQL Server makes a specific distinction between scheduling and memory nodes. This allows you to scale up or down the SQL Server schedulers without restarting the SQL Server.
Budgets are scaled to a benchmark network & device. Late-loading JavaScript can cause “server-side rendered” pages to fail in infuriating ways. The server sends it as a stream of bytes and when the browser encounters each of the sub-resources referenced in the document, it requests them. Global Ground-Truth.
Key areas include: Configuration parameter tuning : This tuning involves altering variables such as memory allocation, disk I/O settings, and concurrent connections based on specific hardware and requirements. This not only results in cost savings by minimizing hardware requirements but also has the potential to decrease cloud expenses.
This results in expedited query execution, reduced resource utilization, and more efficient exploitation of the available hardware resources. Reduced Resource Usage Optimizing resource-intensive queries and configurations can lead to a reduced burden on your server. Indexing is another powerful technique for query optimization.
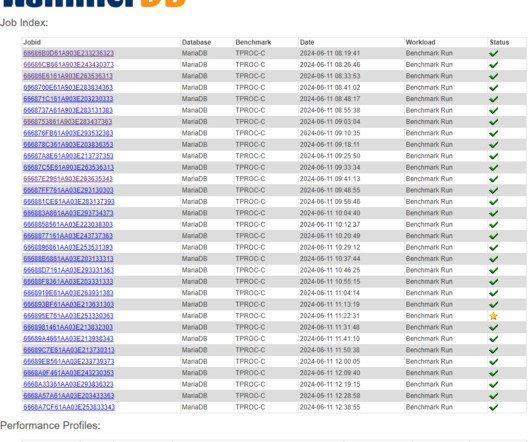
Arguably, the most common beginning errors with database benchmarking is for a user to select a single point of utilisation (usually overconfigured) and then extrapolate conclusions about system performance from this single point. The performance profile allows you to group these related TPROC-C workloads together with a single profile ID.
A full understanding of why this is important requires some knowledge of the evolution of database hardware and software. The HammerDB TPROC-C workload by design intended as CPU and memory intensive workload derived from TPC-C – so that we get to benchmark at maximum CPU performance at a much smaller database footprint.
Last time around we looked at the DeathStarBench suite of microservices-based benchmark applications and learned that microservices systems can be especially latency sensitive, and that hotspots can propagate through a microservices architecture in interesting ways. When available, it can use hardware level performance counters.
Before you begin tuning your website or application, you must first figure out which metrics matter most to your users and establish some achievable benchmarks. Bottlenecks can occur, for example, if you have a sudden surge in traffic that your servers are not equipped to handle. What is Performance Testing?
Understanding DBaaS DBaaS cloud services allow users to use databases without configuring physical hardware and infrastructure or installing software. Doing extensive benchmarks will be the subject of a future blog post. In any case, you should benchmark both RDS MySQL and Aurora before taking the decision to migrate.
This server is spending about a third of its CPU cycles just checking the time! As a Xen guest, this profile was gathered using perf(1) and the kernel's software cpu-clock soft interrupts, not the hardware NMI. 30.14% in the middle of the flame graph. Searching shows it was elsewhere as well for a total of 32.1%.
As is also the case this limitation is at the database level (especially the storage engine) rather than the hardware level. For anyone benchmarking MySQL with HammerDB it is important to understand the differences from sysbench workloads as HammerDB is targeted at a testing a different usage model from sysbench. perf special.
This server is spending about a third of its CPU cycles just checking the time! As a Xen guest, this profile was gathered using perf(1) and the kernel's software cpu-clock soft interrupts, not the hardware NMI. 30.14% in the middle of the flame graph. Searching shows it was elsewhere as well for a total of 32.1%.
KEY partitioning KEY partitioning is similar to HASH partitioning, except that only one or more columns to be evaluated are specified, and the MySQL server provides its own hashing function. Any partitioning strategy should improve query performance , not lead to suboptimal queries — test and benchmark strategies before implementation.
An open-source benchmark suite for microservices and their hardware-software implications for cloud & edge systems Gan et al., A typical architecture diagram for one of these services looks like this: Suitably armed with a set of benchmark microservices applications, the investigation can begin! Hardware implications.
Microsoft, Windows, Windows NT, and Windows Server are registered trademarks of Microsoft Corporation in the United States and/or other countries. The names of actual companies and products mentioned herein may be the trademarks of their respective owners.
I suggest it’s long past time to move beyond C and SPEC benchmarks and our exclusive focus on “metal” languages. There are already standard benchmark suites for JavaScript performance in the browser, and we can include applications written in node.js (server-side JavaScript), Python web servers, and more.
A close monitoring of the hardware enthusiast community, including many of the most respected hardware analysts and reviewers paints an even more dire picture about Intel in the server processor space. Despite all of this, Intel is not going to lose their entire server processor business any time soon.
We organize all of the trending information in your field so you don't have to. Join 5,000+ users and stay up to date on the latest articles your peers are reading.
You know about us, now we want to get to know you!
Let's personalize your content
Let's get even more personalized
We recognize your account from another site in our network, please click 'Send Email' below to continue with verifying your account and setting a password.


Let's personalize your content