This site uses cookies to improve your experience. To help us insure we adhere to various privacy regulations, please select your country/region of residence. If you do not select a country, we will assume you are from the United States. Select your Cookie Settings or view our Privacy Policy and Terms of Use.
Cookie Settings
Cookies and similar technologies are used on this website for proper function of the website, for tracking performance analytics and for marketing purposes. We and some of our third-party providers may use cookie data for various purposes. Please review the cookie settings below and choose your preference.
Used for the proper function of the website
Used for monitoring website traffic and interactions
Cookie Settings
Cookies and similar technologies are used on this website for proper function of the website, for tracking performance analytics and for marketing purposes. We and some of our third-party providers may use cookie data for various purposes. Please review the cookie settings below and choose your preference.
Strictly Necessary: Used for the proper function of the website
Performance/Analytics: Used for monitoring website traffic and interactions
This article explores the impact of different storage formats, specifically Parquet, Avro, and ORC on query performance and costs in big data environments on Google Cloud Platform (GCP). This article provides benchmarks, discusses cost implications, and offers recommendations on selecting the appropriate format based on specific use cases.
Instead, they can ensure that services comport with the pre-established benchmarks. Using data from Dynatrace and its SLO wizard , teams can easily benchmark meaningful, user-based reliability measurements and establish error budgets to implement SLOs that meet business objectives and drive greater DevOps automation.
How To Benchmark And Improve Web Vitals With Real User Metrics. How To Benchmark And Improve Web Vitals With Real User Metrics. Different products will have different benchmarks and two apps may perform differently against the same metrics, but still rank quite similarly to our subjective “good” and “bad” verdicts.
One, by researching on the Internet; Two, by developing small programs and benchmarking. According to other comparisons [Google for 'Performance of Programming Languages'] spread over the net, they clearly outshine others in all speed benchmarks. The legacy languages — be it ASM or C still rule in terms of performance.
Google has a pretty tight grip on the tech industry: it makes by far the most popular browser with the best DevTools, and the most popular search engine, which means that web developers spend most of their time in Chrome, most of their visitors are in Chrome, and a lot of their search traffic will be coming from Google.
Running speed tests with tools like Google PageSpeed Insights , WebPageTest , or KeyCDN’s Website Speed Test are always a good way to help gauge your website’s performance. With that being said, see how we easily achieved a 100/100 score with WordPress and Google PageSpeed Insights. Why Care About Page Speed?
However, as an internal benchmark, there are compelling reasons why some of you may actually want to keep tracking these ‘outdated’ metrics… Measure the User Experience The problem with using diagnostic metrics like Load or DOMContentLoaded to measure site-speed is that it has no bearing on how a user might actually experience your site.
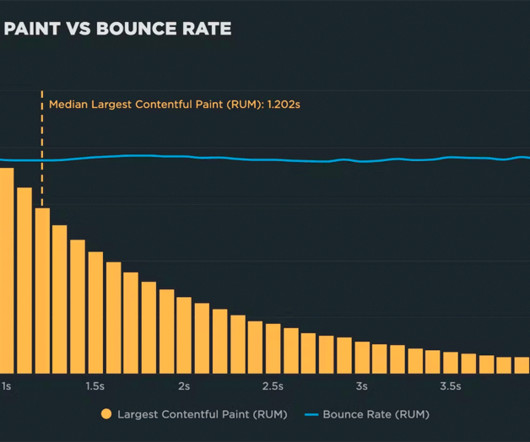
Largest contentful paint (LCP) was also selected as one of the three Core Web Vitals by Google. Google considers an LCP of less than 2.5 This is definitely a great starting benchmark against which to optimize your application. seconds to be good user experience.
Operation Aurora was a series of cyberattacks in 2009 that specifically targeted major enterprises, including Google, Adobe Systems, Yahoo, and more. Spring4Shell is a very severe vulnerability since if an attacker exploited it, applications could be vulnerable to remote code execution (RCE).
Additionally, include benchmarks for stakeholders and best practices that support the anticipated growth of the organization as a whole. Public, private, and hybrid cloud computing platforms such as Microsoft Azure and Google Cloud provide access, development, and management of cloud applications and services. FinOps company culture.
Consider how AI-enabled chatbots such as ChatGPT and Google Bard help DevOps teams write code snippets or resolve problems in custom code without time-consuming human intervention. Additionally, software analytics enhances the digital customer experience by enabling faster service for high-quality offerings. Operations.
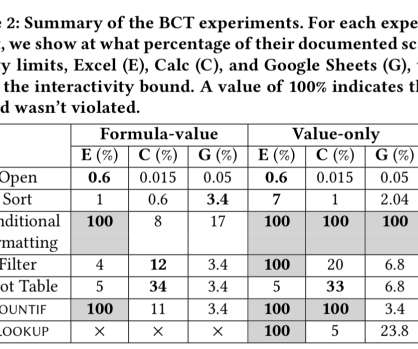
Benchmarking spreadsheet systems Rahman et al., construct a set of benchmarks to try and understand what might be going on under the covers in Microsoft Excel, Google Sheets, and LibreOffice Calc. With formula-value datasets, Excel, Calc, and Google Sheets fail to meet the interactivity barrier at just 6000, 150(!)
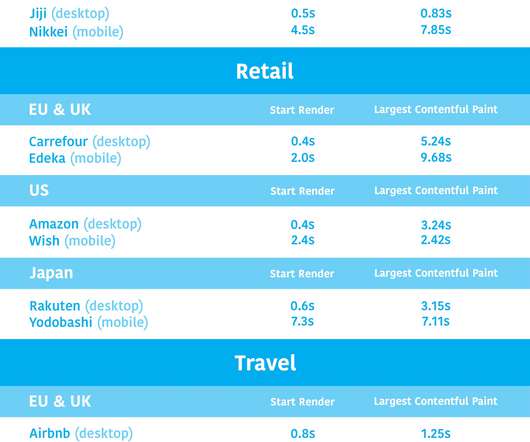
Page Speed Benchmarks is an interactive dashboard that lets you explore and compare web performance data for leading websites across several industries – from retail to media – over the past year. LCP is one of Google's Core Web Vitals , so it should be on your radar, especially if you care about SEO. Testing details.
vl : I have a hilarious story about this from Google: I wanted second 30" monitor, so I filed a ticket. JavaScript benchmark. After decades of pain, we have finally concluded that hierarchies of concepts don't work. That's not an obvious statement at all. After all, nobody gets fired from creating a hierarchy. How does Apple do it?!
How does page bloat affect other metrics, such as Google's Core Web Vitals? A Google machine-learning study I participated in a few years ago found that the total number of page elements was the single greatest predictor of conversions. You can dive deeper into image optimization and SEO tips in this article in Google Search Central.).
To deliver outstanding customer experience for your applications and websites, you need reliable benchmarks that measure what good customer experience looks like. Dynatrace news. Dynatrace Visually complete is a point-in-time web performance metric that measures when the visual area of a page has finished loading.
four petabytes : added to Internet Archive per year; 60,000 : patents donated by Microsoft to the Open Invention Network; 30 million : DuckDuckGo daily searches; 5 seconds : Google+ session length; 1 trillion : ARM device goal; $40B : Softbank investment in 5G; 30 : Happy Birthday IRC!; They'll love it and you'll be their hero forever.
However still far from Google ($28B) and Facebook ($13.2B). Eli Bendersky : Just for fun, I rewrote the same benchmark in Go; two goroutines ping-ponging short message between themselves over a channel. Dare Obasanjo : Amazon made $2.2B from search ads last quarter. Expect next step is for Amazon ads to start show scale.
Essentially, a web vital is a quality standard for UX and web performance set by Google. PageSpeed Compare is a page speed evaluation and benchmarking tool. It measures the web performance of a single page using Google PageSpeed Insights. You can export the results as a CSV file for Excel, Google Sheets or Apple Pages.
Google’s best practice is to have a speed index under 3 seconds. Google’s best practice is to be below 0.5 However, Google’s best practice is to keep the number of requests below 50, so there is still work to be done. Google’s best practice is to achieve a time under 1.3 seconds on desktop and 11.4
Most Linux users cannot afford the amount of resource large enterprises like Google put into custom Linux performance tuning… For Google of course, there’s an economy of scale that makes all that effort worth it. On the exact same hardware, the benchmark suite is then used to test 36 Linux release versions from 3.0
One free tool has become prominent in the space – Google Lighthouse – and one question often bubbles up: “I use Google Lighthouse for one-off snapshots of my site’s performance, so why do I need a performance monitoring solution?” Where Google Lighthouse Shines Bright.
If you’d like to dive deeper into the performance of Android and iOS devices, you can check Geekbench Android Benchmarks for Android smartphones and tablets, and iOS Benchmarks for iPhones and iPads. With Core Web Vitals , Google has been pushing the experience factors on mobile further to the forefront. billion by 2026.
2022: Upstreaming, first attempt Other large companies with OS and perf teams (Meta, Google) hinted strongly that they had already enabled frame pointers for everything years earlier. Google should be no surprise because they pioneered continuous profiling.) Back-end servers. Bear in mind that Netflix doesn't even use Fedora!)
Back in May, we shared that SpeedCurve supports Google's Core Web Vitals in both our synthetic monitoring and LUX real user monitoring tools. According to Google, pages should maintain a CLS score of less than 0.1 Here are the current US media benchmarks on a fast desktop connection , ranked by CLS score. recommended by Google.
Instead, I suggest that web designers use another Google testing tool called Test My Site. Test My Site is a mobile page speed testing tool from Think with Google. Although we’ve been told for years that visitors are willing to wait three seconds for a web page to load , Google considers 2.9 seconds too long.
As an engineer on a browser team, I'm privy to the blow-by-blow of various performance projects, benchmark fire drills, and the ways performance marketing (deeply) impacts engineering priorities. With each team, benchmarks lost are understood as bugs. PowerPoint or Google Slides). This is as it should be. Trusted Types.
LCP is relatively new, and has received a great deal of attention since it was introduced a couple of years ago as part of Google's Core Web Vitals. Related: Web performance for retailers How to create correlation charts How to benchmark your site against your competitors How to set up real user monitoring (RUM)
Benchmark your site against your competitors Our public-facing Industry Benchmarks dashboard gets a lot of visits, but did you know you can create your own custom competitive benchmarking dashboard in SpeedCurve? READ : How to create a competitive benchmark dashboard ––––– 4.
Last time out we saw how Google have been able to save millions of dollars though memory compression enabled via zswap. Looking across a set of eight Java benchmarks, we find that only two of them are array dominated, the rest having between 40% to 75% of the heap footprint allocated to objects, the vast majority of which are small.
As if website speed wasn’t enough, Google has recently announced that user metrics will become a core ranking factor by 2021. Web performance solutions like Dotcom-Monitor offer real browser-based monitoring for your web pages and applications to establish performance benchmarks. Dotcom-Monitor Website Monitoring.
Every front-end developer is chasing the same holy grail of performance: green scores in Google Page Speed. Today, the website is much faster and ranks highly in various showcases and benchmarks. Additionally, page speed is a ranking factor for search and also for your Google Ads. Jennifer Brehm. 2021-06-02T10:30:00+00:00.
We track LEGO.com, along with a handful of other leading ecommerce sites, in our public-facing Retail Benchmarks dashboard , which I encourage you to check out. According to Google's thresholds, an LCP time of 3.96 Optimizing the critical rendering path could make this page a star on the Retail Benchmarks leaderboard.
Google recommends that TTFB be 800ms at the 75th percentile. Looking at the industry benchmarks for US retailers , four well-known sites have backend times that are approaching – or well beyond – that threshold. For more years than I care to mention, I've been advising folks that their TTFB should be under 500ms.
SpeedCurve focuses on a third which I like to call web performance benchmarking. Real user monitoring (RUM) sends performance data directly from a user's browser to a cloud service like New Relic or Google Analytics that aggregates and reports on millions of combined measurements. Web Performance Benchmarking. Uptime Monitoring.
In the prototype implementation, policies are expressed in a language similar to Google Cloud Firestore security rules. A Piazza-style class forum discussion application with 1M posts, 1,000 classes, and a privacy policy allowing TAs to see anonymous posts is used as the basis for benchmarking. Expressing privacy policies.
The most popular, by far, is the Google Lighthouse report (available in Chrome Developer Tools) and Google’s Page Speed Insights. They are more of a benchmark than a true measurement of real user experience. Configuring WebPageTest to run a test measurement that simulates a failure of the Google Fonts third-party service.
In the show, Google is portrayed by the fictional company Hooli, which is after Pied Piper’s intellectual property. The funny thing is that, while being far from a startup, Google does indeed have a powerful compression engine in real life called Brotli. This article is about my experience using Brotli at production scale.
An overview of tools for measuring performance, uptime monitoring, real user monitoring and performance benchmarking. Diagnotic Tools WebPagetest and how to read a browser waterfall Google Pagespeed Insights YSlow. Competitive Benchmarking SpeedCurve. How to make your website faster. Optimization tools and techniques.
seconds or less, which is Google's recommendation for page experience and SEO. > Largest Contentful Paint (Synthetic and RUM) Largest Contentful Paint (LCP) is one of Google's Core Web Vitals. > Cumulative Layout Shift (Synthetic and RUM) Cumulative Layout Shift (CLS) is another one of Google's Core Web Vitals.
First, it is used as a factor in the Google Lighthouse Performance Score. You can track and trend on our Performance KPI chart, create an interactivity centered data block, or even benchmark yourself with Alexa’s Top 5000 best-performing sites through the Executive Dashboard. So why measure FCI?
Establishing clear service-level agreements is key as they outline specific responsibilities and performance benchmarks expected from cloud service providers during disaster recovery scenarios. Multi-cloud strategies for disaster recovery incorporate redundancies through several cloud providers, which ensure additional backups are available.
Before you begin tuning your website or application, you must first figure out which metrics matter most to your users and establish some achievable benchmarks. Google Lighthouse Google Lighthouse is a free and open source tool that is part of the Google Chrome DevTools family. What is Performance Testing?
Google has one , too. When you create a linter, you are setting a benchmark of quality for your documentation. Microsoft has a whole website that serves as a comprehensive guide, covering everything from acronyms to bias-free communication to chatbots. Microsoft of course isn’t the only company that has a style guide.
We organize all of the trending information in your field so you don't have to. Join 5,000+ users and stay up to date on the latest articles your peers are reading.
You know about us, now we want to get to know you!
Let's personalize your content
Let's get even more personalized
We recognize your account from another site in our network, please click 'Send Email' below to continue with verifying your account and setting a password.


Let's personalize your content