This site uses cookies to improve your experience. To help us insure we adhere to various privacy regulations, please select your country/region of residence. If you do not select a country, we will assume you are from the United States. Select your Cookie Settings or view our Privacy Policy and Terms of Use.
Cookie Settings
Cookies and similar technologies are used on this website for proper function of the website, for tracking performance analytics and for marketing purposes. We and some of our third-party providers may use cookie data for various purposes. Please review the cookie settings below and choose your preference.
Used for the proper function of the website
Used for monitoring website traffic and interactions
Cookie Settings
Cookies and similar technologies are used on this website for proper function of the website, for tracking performance analytics and for marketing purposes. We and some of our third-party providers may use cookie data for various purposes. Please review the cookie settings below and choose your preference.
Strictly Necessary: Used for the proper function of the website
Performance/Analytics: Used for monitoring website traffic and interactions
As a strategic ISV partner, Dynatrace and Azure are continuously and collaboratively innovating, focusing on a strong build-with motion dedicated to bringing innovative solutions to market to deliver better customer value. Read on to learn more about how Dynatrace and Microsoft leverage AI to transform modern cloud strategies.
Microsoft Azure SQL is a robust, fully managed database platform designed for high-performance querying, relational data storage, and analytics. An application software generates user metrics on a daily basis, which can be used for reports or analytics.
In September, we announced the availability of the Dynatrace Software Intelligence Platform on Microsoft Azure as a SaaS solution and natively in the Azure portal. Today, we are excited to provide an update that Dynatrace SaaS on Azure is now generally available (GA) to the public through Dynatrace sales channels.
Azure Native Dynatrace Service allows easy access to new Dynatrace platform innovations Dynatrace has long offered deep integration into Azure and Azure Marketplace with its Azure Native Dynatrace Service, developed in collaboration with Microsoft. The following figure shows the benefits of Azure Native Dynatrace Service.
Dynatrace, available as an Azure-native service , has a longstanding partnership with Microsoft, deeply rooted in a strong “build with” approach to deliver seamless user experience. This enables Dynatrace customers to achieve faster time-to-value and accelerate innovation.
This extension provides fully app-centric Cassandra performance monitoring for Azure Managed Instance for Apache Cassandra. Azure Managed Instance for Apache Cassandra vs Azure Cosmos DB Cassandra API. Microsoft Azure offers multiple ways to manage Apache Cassandra databases.
Azure Automation provides an extremely powerful set of tools for automating operations within enterprises on hybrid cloud. You can now simplify cloud operations with automated observability into the performance of your Azure cloud platform services in context with the performance of your applications. What is Azure Automation?
More than 95% of Fortune 500 companies use Microsoft Azure. Azure provides a wide variety of cloud services with globally distributed applications. Running containers in the cloud is also a very popular use case for Azure. These challenges make Azure observability critical for building and monitoring cloud-native applications.
Dynatrace is proud to provide deep monitoring support for Azure Linux as a container host operating system (OS) platform for Azure Kubernetes Services (AKS) to enable customers to operate efficiently and innovate faster. What is Azure Linux? Why monitor Azure Linux container host for AKS? Resource utilization management.
Some time ago, we announced monitoring coverage for all Azure Monitor services , as well as the ability to purchase the Dynatrace Software Intelligence Platform through the Microsoft Azure Marketplace. Now, Dynatrace and Microsoft have further deepened their partnership by making Dynatrace for Azure generally available.
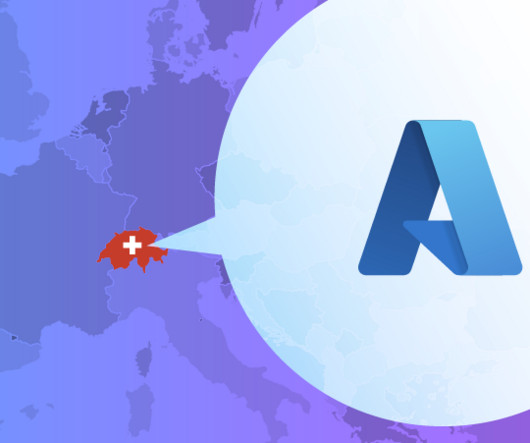
After meeting the necessary requirements, we are excited to announce that the Dynatrace AI-powered platform as a SaaS on Microsoft Azure is now available in Switzerland. Now, Dynatrace is available in Microsoft’s Switzerland North Azure region.
Dynatrace has partnered with the Microsoft Azure App Service team to seamlessly integrate enhanced observability with Linux App Service using the powerful Sidecar Pattern for containerized computing. It handles tasks like collecting metrics, tracing requests, and capturing logs independently. Decoupled integration.
When customers utilize the services of a specific cloud provider, such as Microsoft Azure, users within the organization eventually become experts in working with, administering, and managing the cloud resources of that provider. To establish the necessary monitoring, the observability team typically must be granted new setup permissions.
Dynatrace has enhanced its partnership with Microsoft Azure, providing users a quick and easy path to purchasing, configuring, and managing Dynatrace directly inside the Microsoft Azure Portal. Dynatrace is excited to announce this enhancement is now in public preview for any Azure customer to evaluate. Dynatrace news.
As organizations adopt microservices architecture with cloud-native technologies such as Microsoft Azure , many quickly notice an increase in operational complexity. To guide organizations through their cloud migrations, Microsoft developed the Azure Well-Architected Framework. What is the Azure Well-Architected Framework?
To make this happen, enterprises are shifting an unprecedented volume of workloads onto cloud platforms such as Microsoft Azure. How Azure digital transformation helps There are three ways that Microsoft Azure can help organizations do more with less when it comes to organizations’ digital transformation journeys. Optimization.
Optimizing cloud services can prove quite challenging because logs, metrics, and traces are not always put together in context, and you don’t have access to the underlying hosts. This is done by Dynatrace automatically after you forward your Azure services logs. Use custom metrics based on logs for constant optimization.
x runtime versions of Azure Functions running in an Azure App Service plan. This gives you deep visibility into your code running in Azure Functions, and, as a result, an understanding of its impact on overall application performance and user experience. Azure Functions in a nutshell. Optimize timing hotspots.
What is Azure Functions? Similar to AWS Lambda , Azure Functions is a serverless compute service by Microsoft that can run code in response to predetermined events or conditions (triggers), such as an order arriving on an IoT system, or a specific queue receiving a new message. The growth of Azure cloud computing.
Versatile, feature-rich cloud computing environments such as AWS, Microsoft Azure, and GCP have been a game-changer. Cloud computing environments like AWS, Azure, and GCP offer a wide array of computing capabilities and capacity. It includes metrics, dashboards, alerts, events, logs, and cross-environment traces.
In IT and cloud computing, observability is the ability to measure a system’s current state based on the data it generates, such as logs, metrics, and traces. If you’ve read about observability, you likely know that collecting the measurements of logs, metrics, and distributed traces are the three key pillars to achieving success.
Dynatrace collects a huge number of metrics for each OneAgent-monitored host in your environment. Depending on the types of technologies you’re running on individual hosts, the average number of metrics is about 500 per computational node. Running metric queries on a subset of entities for live monitoring and system overviews.
Hopefully, this blog will explain ‘why,’ and how Microsoft’s Azure Monitor is complementary to that of Dynatrace. Do I need more than Azure Monitor? Azure Monitor features. Application Insights – Collects performance metrics of the application code. Available as an agent installer).
As adoption rates for Microsoft Azure continue to skyrocket, Dynatrace is developing a deeper integration with the platform to provide even more value to organizations that run their businesses on Azure or use it as a part of their multi-cloud strategy. Azure Batch. Azure DB for MariaDB. Azure DB for MySQL.
x runtime versions of Azure Functions running in an Azure App Service plan. This gives you deep visibility into your code running in Azure Functions, and, as a result, an understanding of its impact on overall application performance and user experience. Azure Functions in a nutshell. Optimize timing hotspots.
See into cloud blind spots Versatile, feature-rich cloud computing environments such as Amazon Web Services, Microsoft Azure, and Google Cloud Platform have been a game-changer, enabling DevOps teams to deliver greater capabilities on a wider scale.
With the advent and ingestion of thousands of custom metrics into Dynatrace, we’ve once again pushed the boundaries of automatic, AI-based root cause analysis with the introduction of auto-adaptive baselines as a foundational concept for Dynatrace topology-driven timeseries measurements. In many cases, metric behavior changes over time.
The Carbon Impact app directly supports our customers sustainability efforts through granular real-time emissions reporting and analytics, translating host utilization metrics into their CO2 equivalent (CO2e). We implemented a wasted energy metric in the app to enhance practitioner actionability.
Go deeper into distributed and Google Cloud workloads Customers will receive the latest version of Dynatrace SaaS, which is already available on AWS and Microsoft Azure. New customers will get the latest experience by default after general availability.
We added monitoring and analytics for log streams from Kubernetes and multicloud platforms like AWS, GCP, and Azure, as well as the most widely used open-source log data frameworks. Whatever your use case, when log data reflects changes in your infrastructure or business metrics, you need to extract the metrics and monitor them.
With Azure Deployment Slots, a feature of the Azure App Service, you can create one or more slots that can host different versions of your app. You can now simplify cloud operations with automated observability into the performance of your Azure cloud platform services in context with the performance of your applications. .
As adoption rates for Azure continue to skyrocket, Dynatrace is developing a deeper integration with the Azure platform to provide even more value to organizations that run their businesses on Microsoft Azure or have Microsoft as a part of their multi-cloud strategy. More than just metrics. Dynatrace news.
This preview allows for the collection of Prometheus metrics in Azure Monitor. If you've used Azure Kubernetes Service (AKS), you may know you have the option to connect your AKS cluster up to Azure monitor. If you connect your cluster, Azure monitor deploys a collector agent pod. Prometheus.
These functions are executed by a serverless platform or provider (such as AWS Lambda, Azure Functions or Google Cloud Functions) that manages the underlying infrastructure, scaling and billing. Observability is typically achieved by collecting three types of data from a system, metrics, logs and traces.
Leveraging cloud-native technologies like Kubernetes or Red Hat OpenShift in multicloud ecosystems across Amazon Web Services (AWS) , Microsoft Azure, and Google Cloud Platform (GCP) for faster digital transformation introduces a whole host of challenges. Dynatrace news. Collecting data requires massive and ongoing configuration efforts.
Ingest data remotely through cloud integrations covering Amazon CloudWatch, Azure Monitor, Azure Liftr, and Google Cloud™ Kubernetes with GKE™ AutoPilot cluster. Vulnerabilities Prioritize and sort vulnerabilities based on Davis Security Score, detection time, or the number of affected entities.
AWS , Azure. AWS , Azure. AWS , Azure. AWS , Azure. AWS , Azure. AWS , Azure. AWS , Azure. AWS , Azure , DigitalOcean. Are you a startup that has free AWS or Azure hosting credits you’d like to use for your database hosting? Do you want to deploy in an AWS VPC or Azure VNET?
While an SLI is just a metric, an SLO just a threshold you expect your SLI to be in and SLA is just the business contract on top of an SLO. Thanks to its event-driven architecture, Keptn can pull SLIs (=metrics) from different data sources and validate them against the SLOs. class SRE implements DevOps) !
You can create custom log metrics for smarter and faster troubleshooting, and you will be able to understand log data in the context of your full stack, including real user impacts. The default values cover a large range of different cluster sizes; you can modify them according to your needs, based on the ActiveGate self-monitoring metrics.
Here is the first batch of 15 public locations for HTTP monitoring: Chicago (Azure) ?, Virginia (Azure), N. California (AWS), San Jose (Azure), Texas (Azure), Ohio (AWS), Toronto (Azure) ?, London (AWS), London (Azure), Frankfurt (AWS) ?, Hong Kong (Azure), Tokyo (Azure), Sao Paulo (AWS).
Metrics are an essential functionality provided by the Dynatrace Software Intelligence Platform. Dynatrace OneAgent and ActiveGate extensions provide you with a multitude of metrics. We also empower you with the ability to ingest your own custom metrics and leverage those metrics using a variety of Dynatrace features.
As a full stack monitoring platform, Dynatrace collects a huge number of metrics for each OneAgent monitored host in your environment. Depending on the types of technologies you’re running on your individual hosts, the average number of metrics is about 500 per computational node. New metric identifiers and structure.
VMware commercialized the idea of virtual machines, and cloud providers embraced the same concept with services like Amazon EC2, Google Compute, and Azure virtual machines. You’ll benefit from serverless computing when: Authenticating users (for example, Okta , Azure Active Directory ).
Symptoms : No data is provided for affected metrics on dashboards, alerts, and custom device pages populated by the affected extension metrics. Select a specific queue or topic to display details about its connected producer and consumer services, as well as technology-specific metrics. Extension logs display errors.
We organize all of the trending information in your field so you don't have to. Join 5,000+ users and stay up to date on the latest articles your peers are reading.
You know about us, now we want to get to know you!
Let's personalize your content
Let's get even more personalized
We recognize your account from another site in our network, please click 'Send Email' below to continue with verifying your account and setting a password.


Let's personalize your content