This site uses cookies to improve your experience. To help us insure we adhere to various privacy regulations, please select your country/region of residence. If you do not select a country, we will assume you are from the United States. Select your Cookie Settings or view our Privacy Policy and Terms of Use.
Cookie Settings
Cookies and similar technologies are used on this website for proper function of the website, for tracking performance analytics and for marketing purposes. We and some of our third-party providers may use cookie data for various purposes. Please review the cookie settings below and choose your preference.
Used for the proper function of the website
Used for monitoring website traffic and interactions
Cookie Settings
Cookies and similar technologies are used on this website for proper function of the website, for tracking performance analytics and for marketing purposes. We and some of our third-party providers may use cookie data for various purposes. Please review the cookie settings below and choose your preference.
Strictly Necessary: Used for the proper function of the website
Performance/Analytics: Used for monitoring website traffic and interactions
The Dynatrace platform has been recognized for seamlessly integrating with the Microsoft Sentinel cloud-native security information and event management ( SIEM ) solution. These reports are crucial for tracking changes, compliance, and security-relevant events. Runtime application protection.
Azure Native Dynatrace Service allows easy access to new Dynatrace platform innovations Dynatrace has long offered deep integration into Azure and Azure Marketplace with its Azure Native Dynatrace Service, developed in collaboration with Microsoft. The following figure shows the benefits of Azure Native Dynatrace Service.
Dynatrace is proud to provide deep monitoring support for Azure Linux as a container host operating system (OS) platform for Azure Kubernetes Services (AKS) to enable customers to operate efficiently and innovate faster. What is Azure Linux? Why monitorAzure Linux container host for AKS? Performance.
On average, organizations use 10 different tools to monitor applications, infrastructure, and user experiences across these environments. Clearly, continuing to depend on siloed systems, disjointed monitoring tools, and manual analytics is no longer sustainable.
Despite its benefits, serverless computing introduces additional monitoring challenges for developers and IT Operations, particularly in understanding dependencies and identifying issues in the end-to-end traces that flow through a complex mix of dynamic and hybrid on-premise/cloud environments. Azure Functions in a nutshell.
Azure Automation provides an extremely powerful set of tools for automating operations within enterprises on hybrid cloud. You can now simplify cloud operations with automated observability into the performance of your Azure cloud platform services in context with the performance of your applications. What is Azure Automation?
Despite its benefits, serverless computing introduces additional monitoring challenges for developers and IT Operations, particularly in understanding dependencies and identifying issues in the end-to-end traces that flow through a complex mix of dynamic and hybrid on-premise/cloud environments. Azure Functions in a nutshell.
Breaking monolithic pipelines into event-driven Delivery Choreography. Embrace event-driven auto-remediation with an SLO-based safety net. It’s a free virtual event so I hope you join me. Thanks to its event-driven architecture, Keptn can pull SLIs (=metrics) from different data sources and validate them against the SLOs.
When you use Dynatrace Log Monitoring, it’s enough to forward your logs and have Dynatrace take care of the rest. This is done by Dynatrace automatically after you forward your Azure services logs. Enabling agentless log ingestion requires you to create additional resources in your Azure account. Optimize database performance.
What is Azure Functions? Similar to AWS Lambda , Azure Functions is a serverless compute service by Microsoft that can run code in response to predetermined events or conditions (triggers), such as an order arriving on an IoT system, or a specific queue receiving a new message. The growth of Azure cloud computing.
Versatile, feature-rich cloud computing environments such as AWS, Microsoft Azure, and GCP have been a game-changer. Cloud computing environments like AWS, Azure, and GCP offer a wide array of computing capabilities and capacity. They need a platform-agnostic way to monitor and manage performance across all of them seamlessly.
As organizations adopt microservices architecture with cloud-native technologies such as Microsoft Azure , many quickly notice an increase in operational complexity. To guide organizations through their cloud migrations, Microsoft developed the Azure Well-Architected Framework. What is the Azure Well-Architected Framework?
This is the second part of our blog series announcing the massive expansion of our Azure services support. Part 1 of this blog series looks at some of the key benefits of Azure DB for PostgreSQL, Azure SQL Managed Instance, and Azure HDInsight. Fully automated observability into your Azure multi-cloud environment.
Dynatrace Digital Experience Monitoring , as part of the Dynatrace Software Intelligence Platform, connects front-end monitoring and the outside-in user perspective with application performance to understand the impact of performance issues across your full stack on user experience and business outcomes. Virginia (Azure), N.
So many default to Amazon RDS, when MySQL performs exceptionally well on Azure Cloud. While Microsoft Azure does offer a managed solution, Azure Database, the solution has some major limitations you should know about before migrating your MySQL deployments. The Best Way to Host MySQL on Azure Cloud Click To Tweet.
Log monitoring, log analysis, and log analytics are more important than ever as organizations adopt more cloud-native technologies, containers, and microservices-based architectures. Driving this growth is the increasing adoption of hyperscale cloud providers (AWS, Azure, and GCP) and containerized microservices running on Kubernetes.
Cloud providers, such as AWS, Azure, and GCP, help to automate the process of upscaling or downscaling compute power by providing autoscaling groups. To enable you to automatically detect the shutdown of spot instances and the scaling up or down of third-party autoscaling solutions, we’ve introduced a new event type.
More specifically, I’ll demonstrate how in just a few steps, you can add Dynatrace information events to your Azure DevOps release pipelines for things like deployments, performance tests, or configuration changes. Microsoft DevOps Azure is one of the best CI/CD systems and a strategic technical Dynatrace partner. Dynatrace API.
With Azure Deployment Slots, a feature of the Azure App Service, you can create one or more slots that can host different versions of your app. You can now simplify cloud operations with automated observability into the performance of your Azure cloud platform services in context with the performance of your applications. .
Dynatrace container monitoring supports customers as they collect metrics, traces, logs, and other observability-enabled data to improve the health and performance of containerized applications. VAPO is available in both Microsoft Azure and AWS. We’re using automation to kick off scaling events,” he said. “We
Leveraging cloud-native technologies like Kubernetes or Red Hat OpenShift in multicloud ecosystems across Amazon Web Services (AWS) , Microsoft Azure, and Google Cloud Platform (GCP) for faster digital transformation introduces a whole host of challenges. Dynatrace news. Logs provide information you can’t find anywhere else.
Serverless applications are composed of event-driven functions that run on demand in response to triggers from various sources, such as HTTP requests, messages, or timers. Connect Dynatrace to your cloud-vendor to gather relevant infrastructure monitoring data, which gives you essential health insights.
Log Monitoring documentation. Starting with Dynatrace version 1.239, we have restructured and enhanced our Log Monitoring documentation to better focus on concepts and information that you, the user, look for and need. Log Monitoring. Legacy Log Monitoring v1 Documentation. Kubernetes/OpenShift monitoring setup.
Complex syslog ecosystems can be challenging Monitoring devices and applications that provide output via the syslog protocol is a must-have for many organizations. You also might be required to capture syslog messages from cloud services on AWS, Azure, and Google Cloud related to resource provisioning, scaling, and security events.
Cloud vendors such as Amazon Web Services (AWS), Microsoft, and Google provide a wide spectrum of serverless services for compute and event-driven workloads, databases, storage, messaging, and other purposes. In addition, Davis provides automatic alerting of service-to-service communication problems using queues and other event systems.
Observability and monitoring as a source of truth. Logs represent event data in plain-text, structured or binary format. To provide actionable answers monitoring systems store, baseline, and analyze telemetry data. Monitoring your i nfrastructure. Traces help find the flow of a request through a distributed system.
Part 1 of this series starts will cover the key ingredients needed for successful DevOps use to deliver better software faster, followed by a short overview of GitHub Actions and example use cases related to deployment and release monitoring. Component levels information events such as releases and configuration changes.
VMware commercialized the idea of virtual machines, and cloud providers embraced the same concept with services like Amazon EC2, Google Compute, and Azure virtual machines. You’ll benefit from serverless computing when: Authenticating users (for example, Okta , Azure Active Directory ). Monitoring serverless applications.
This includes OpenAI as well as Azure OpenAI services, such as GPT-3, Codex, DALL-E, or ChatGPT. temperature: 0, max_tokens: 10, }); Once the AI application is started on a OneAgent-monitored server, the application is automatically detected, and the traces and metrics for all outgoing requests are collected.
This release extends auto-adaptive baselines to the following generic metric sources, all in the context of Dynatrace Smartscape topology: Built-in OneAgent infrastructure monitoring metrics (host, process, network, etc.). Calculated service/DEM metrics (revenue numbers, conversions, event counts, etc.). Synthetic monitor metrics.
With this announcement: Davis now automatically ingests additional Kubernetes events and metrics, including state changes, workload changes and critical events across clusters, containers and runtimes. Next-gen Infrastructure Monitoring. Next up, Steve introduced enhancements to our infrastructure monitoring module.
Many organizations also adopt an observability solution to help them detect and analyze the significance of events to their operations, software development life cycles, application security, and end-user experiences. What is the difference between monitoring and observability? Is observability really monitoring by another name?
That said, a unified observability and security platform can enhance modern deployment practices and enable teams to proactively monitor performance, validate changes, and best protect their downstream customers and end users from disruptions. Eliminating the potential for outages may not be possible in all situations.
While to-date it’s been possible to integrate Dynatrace Managed for intelligent monitoring of services running on AWS and Azure, today we’re excited to announce the release of our Dynatrace Managed marketplace listing for the Google Cloud Platform. Optionally you can provide a name for the initial monitoring environment.
An orchestration platform needs to expose data about its internal states and activities in the form of logs, events, metrics, or transaction traces. Amazon Elastic Kubernetes Service , Microsoft Azure Kubernetes Service , and Google Kubernetes Platform each offer their own managed Kubernetes service. Built-in monitoring.
And how can you verify this performance consistently across a multicloud environment that also uses Microsoft Azure and Google Cloud Platform frameworks? Workflows are powered by a core platform technology of Dynatrace called the AutomationEngine. Using an interactive no/low code editor, you can create workflows or configure them as code.
The complexity and numerous moving parts of Kubernetes multicloud clusters mean that when monitoring the health of these clusters—which is critical for ensuring reliable and efficient operation of the application—platform engineers often find themselves without an easy and efficient solution. Want to try it for yourself? Check it out here.
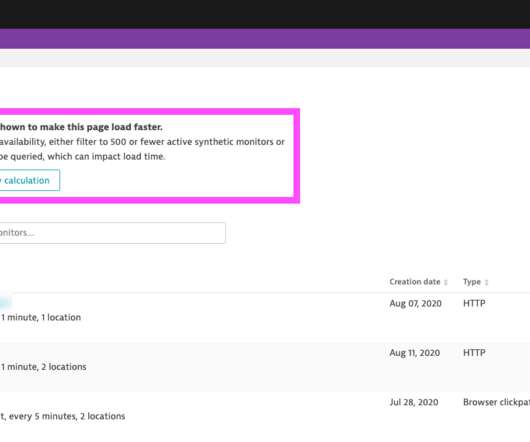
Premium High Availability and Mainframe monitoring on IBM z/OS licenses are now displayed on the Licensing page. Synthetic monitoring. Displaying availability on the Synthetic monitors page. Displaying availability on the Synthetic monitors page. Error code for browser monitors failing basic authentication.
Autonomous Cloud Enablement (ACE) and Keptn – the Event-Driven Autonomous Cloud Control Plane – are helping our Dynatrace customers to automate their delivery and operations processes. The Autonomous Cloud Maturity Path guides you through automating monitoring, performance, delivery and operations. Dynatrace news.
When American Family Insurance took the multicloud plunge, they turned to Dynatrace to automate Amazon Web Services (AWS) event ingestion, instrument compute and serverless cloud technologies, and create a single workflow for unified event management. “We were early adopters of OneAgent Lambda monitoring.
However, while Kubernetes can help teams monitor the health of their environments and restart failed applications, the platform has limited visibility into the internal state of those applications. Importantly, Kubernetes also enables developers to build, deliver, and update microservices-based applications flexibly, reliably, and quickly.
Especially in dynamic microservices architectures, distributed tracing is an essential component of efficient monitoring, application optimization, debugging, and troubleshooting. Microsoft has already introduced Trace Context support in some of their services, including.NET Azure Functions, API Management, and IoT Hub.
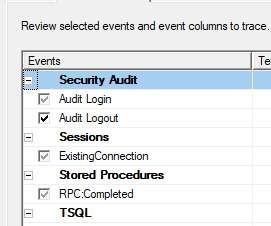
SQL Server has always provided the ability to capture actual queries in an easily-consumable rowset format – first with legacy SQL Server Profiler, later via Extended Events, and now with a combination of those two concepts in Azure SQL Database. Legacy Profiler "Standard" trace events.
We organize all of the trending information in your field so you don't have to. Join 5,000+ users and stay up to date on the latest articles your peers are reading.
You know about us, now we want to get to know you!
Let's personalize your content
Let's get even more personalized
We recognize your account from another site in our network, please click 'Send Email' below to continue with verifying your account and setting a password.


Let's personalize your content