This site uses cookies to improve your experience. To help us insure we adhere to various privacy regulations, please select your country/region of residence. If you do not select a country, we will assume you are from the United States. Select your Cookie Settings or view our Privacy Policy and Terms of Use.
Cookie Settings
Cookies and similar technologies are used on this website for proper function of the website, for tracking performance analytics and for marketing purposes. We and some of our third-party providers may use cookie data for various purposes. Please review the cookie settings below and choose your preference.
Used for the proper function of the website
Used for monitoring website traffic and interactions
Cookie Settings
Cookies and similar technologies are used on this website for proper function of the website, for tracking performance analytics and for marketing purposes. We and some of our third-party providers may use cookie data for various purposes. Please review the cookie settings below and choose your preference.
Strictly Necessary: Used for the proper function of the website
Performance/Analytics: Used for monitoring website traffic and interactions
As organizations shift to hybrid cloud environments, there are two platforms really dominating the market and Microsoft Azure is the fastest growing with adoption rates skyrocketing. Let’s dig into what Azure is all about and some of the use cases. What is Azure? What can Azure do for my business? diverse use cases from?
Despite its benefits, serverless computing introduces additional monitoring challenges for developers and IT Operations, particularly in understanding dependencies and identifying issues in the end-to-end traces that flow through a complex mix of dynamic and hybrid on-premise/cloud environments. Azure Functions in a nutshell.
Azure Automation provides an extremely powerful set of tools for automating operations within enterprises on hybrid cloud. You can now simplify cloud operations with automated observability into the performance of your Azure cloud platform services in context with the performance of your applications. What is Azure Automation?
Despite its benefits, serverless computing introduces additional monitoring challenges for developers and IT Operations, particularly in understanding dependencies and identifying issues in the end-to-end traces that flow through a complex mix of dynamic and hybrid on-premise/cloud environments. Azure Functions in a nutshell.
We also introduced our demo app and explained how to define the metrics and traces it uses. The second part, The road to observability with OpenTelemetry part 2: Setting up OpenTelemetry and instrumenting applications , covers the details of how to set up OpenTelemetry in our demo application and how to instrument the services.
Log monitoring, log analysis, and log analytics are more important than ever as organizations adopt more cloud-native technologies, containers, and microservices-based architectures. Driving this growth is the increasing adoption of hyperscale cloud providers (AWS, Azure, and GCP) and containerized microservices running on Kubernetes.
With Azure Deployment Slots, a feature of the Azure App Service, you can create one or more slots that can host different versions of your app. You can now simplify cloud operations with automated observability into the performance of your Azure cloud platform services in context with the performance of your applications. .
Digital workers are now demanding IT support to be more proactive,” is a quote from last year’s Gartner Survey Understandably, a higher number of log sources and exponentially more log lines would overwhelm any DevOps, SRE, or Software Developer working with traditional log monitoring solutions.
VMware commercialized the idea of virtual machines, and cloud providers embraced the same concept with services like Amazon EC2, Google Compute, and Azure virtual machines. You’ll benefit from serverless computing when: Authenticating users (for example, Okta , Azure Active Directory ). Monitoring serverless applications.
Five available hybrid cloud platforms from the top public cloud providers include the following: Azure Stack : Consumers can access different Azure cloud services from their own data center and build applications for Azure cloud. Automate observability and monitoring. Optimize critical applications’ performance.
Next-gen Infrastructure Monitoring. Next up, Steve introduced enhancements to our infrastructure monitoring module. Davis now automatically provides thresholds and baselining algorithms for all infrastructure performance and reliability metrics to easily scale infrastructure monitoring without manual configuration.
As teams and their structure and metadata are often maintained in a dedicated database, such as Microsoft Entra ID (formerly Azure Active Directory) or ServiceNow. Dynatrace ownership functionality supports configuration-as-code via its proprietary Monaco (Monitoring as code) CLI or Terraform. Contact us to schedule a demo.
In our recent Performance Clinic Automate Business Level Objective Monitoring with Dynatrace & Keptn I was able to live demo the latest version of the Dynatrace SLI Provider for Keptn which now accepts a Dynatrace dashboard as input as you can see in the following example!
DevOps teams operating, maintaining, and troubleshooting Azure, AWS, GCP, or other cloud environments are provided with an app focused on their daily routines and tasks. Monitoring known vulnerabilities within the service hosting the application itself is just another puzzle piece to be considered for full end-to-end observability.
In a time when modern microservices are easier to deploy, GCF, like its counterparts AWS Lambda and Microsoft Azure Functions , gives development teams an agility boost for delivering value to their customers quickly with low overhead costs. Observability and monitoring challenges with Google Cloud Functions. Curious to learn more?
Popular examples include AWS Lambda and Microsoft Azure Functions , but new providers are constantly emerging as this model becomes more mainstream. Serverless solutions introduce a new level of complexity into IT environments by adding another infrastructure layer that requires continual monitoring to ensure efficacy.
As the video alone shows you every step in detail, including live demos, I will just give you a high-level overview and the outcomes of the individual sections: Pre-requisite: Cloud Automation SaaS Tenant. You run load tests monitored with Dynatrace and you want to automatically validate to eliminate the manual analysis effort.
Microsoft Azure. Monitor the project to gain valuable insights on user interactions, user response, and overall success of the project. Container orchestration platform offering orchestration, automation, security, governance, and other capabilities. Open source software containerization platform. Configuration management.
Kubernetes (k8s) provides basic monitoring through the Kubernetes API and you can find instructions like Top 9 Open Source Tools for Monitoring Kubernetes as a “do it yourself guide”. End-user monitoring. Dynatrace news. For EKS – Amazon’s Kubernetes Service – you can get a preview of CloudWatch Container Insights.
From of our learnings on how we integrated Dynatrace into our DevOps toolchain , we advise our customers to follow our best practices around integrating delivery tools with Dynatrace, enforcing Dynatrace-based quality gates, implementing monitoring as code or automate remediation based on Dynatrace problems. Monitoring Configuration as Code.
Application performance monitoring (APM) is the practice of tracking key software application performance metrics using monitoring software and telemetry data. Mobile apps, websites, and business applications are typical use cases for monitoring. APM can be referred to as: Application performance monitoring.
What’s more, their platform delivers improved workload efficiency through backup automation along with performance-optimizing tools specific for various types of databases as well as continuous monitoring & benchmarking capabilities.
Ideas that start in Jira Align are executed in work management tools like Jira , Azure DevOps , and Rally ; tested in tools like Tosca , qTest , Micro Focus ALM and SmartBear ; and supported in ITSM tools like ServiceNow , Jira Service Desk a nd BMC Remedy. . The Easiest, Most Sophisticated Toolchain Integration.
Simeon Cloud is a cloud management platform that provides automated Microsoft 365 configurations, Intune application, Azure AD, and Azure Resource groups including lifecycle management and managing multiple tenants across Microsoft 365 for MSPs. To learn more on how to scale your organization, visit Simeon Cloud and book a demo.
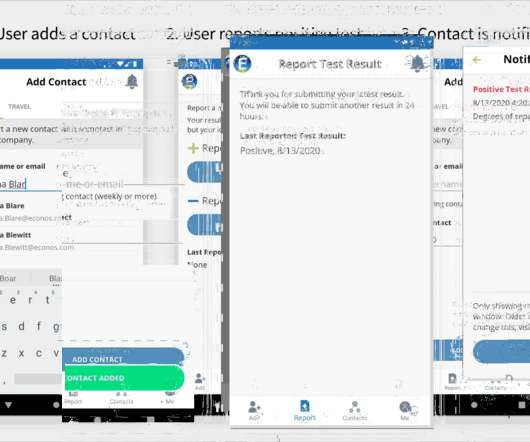
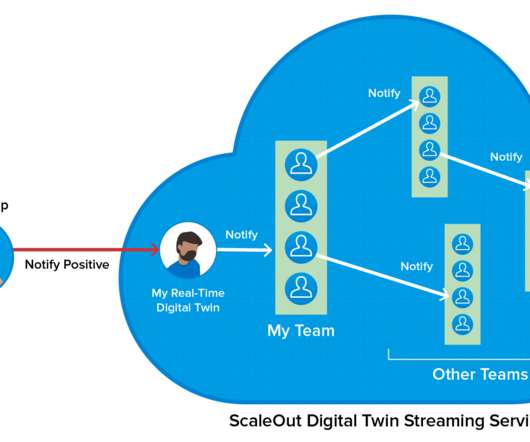
A Demo Application Shows How Companies Can Track COVID-19 Contacts Within Companies. In this post, we’ll take a closer look at its implementation in a demo application created by ScaleOut Software. The demo application creates a memory-based real-time digital twin for each employee. C# was used for the demo application.)
A Demo Application Shows How Companies Can Track COVID-19 Contacts Within Companies. In this post, we’ll take a closer look at its implementation in a demo application created by ScaleOut Software. The demo application creates a memory-based real-time digital twin for each employee. C# was used for the demo application.)
Google Cloud and Microsoft Azure released Scope 3 data in 2021. The last number I saw was “over 20GW”, and Amazon has much better global PPA coverage, including India and China, than Google Cloud and Microsoft Azure, who have very few PPAs in Asia.
Second, while OpenAI’s GPT-4 announcement last March demoed generating website code from a hand-drawn sketch, that capability wasn’t available until after the survey closed. Third, while roughing out the HTML and JavaScript for a simple website makes a great demo, that isn’t really the problem web designers need to solve.
Monitoring widgets on the console are much better now, e.g. for selecting different time periods. Also, you can drill into logs by selecting a time window (dragging a selection) in any monitoring widget. This makes for a very untidy monitoring tab in the Lambda console, but we’ll deal with that for the extra data. But this year?
Here are some examples: • Incidents created in ServiceNow are automatically synchronized to Azure DevOps as bugs. Request a highly-personalized demo to see how integration is the lifeblood of your SAFe transformation and how visualization can help you zoom into the details that makes your software delivery tick.
In this blog post, we will deploy a monitoring dashboard with alerts and notifications as one simple Kubernetes resource. Crossplane providers implement the operator pattern for external systems (for example, AWS, GCP, Azure). Using the Upjet project Now that we have an overview of the concepts, lets look at how we implement our demo.
We organize all of the trending information in your field so you don't have to. Join 5,000+ users and stay up to date on the latest articles your peers are reading.
You know about us, now we want to get to know you!
Let's personalize your content
Let's get even more personalized
We recognize your account from another site in our network, please click 'Send Email' below to continue with verifying your account and setting a password.


Let's personalize your content