This site uses cookies to improve your experience. To help us insure we adhere to various privacy regulations, please select your country/region of residence. If you do not select a country, we will assume you are from the United States. Select your Cookie Settings or view our Privacy Policy and Terms of Use.
Cookie Settings
Cookies and similar technologies are used on this website for proper function of the website, for tracking performance analytics and for marketing purposes. We and some of our third-party providers may use cookie data for various purposes. Please review the cookie settings below and choose your preference.
Used for the proper function of the website
Used for monitoring website traffic and interactions
Cookie Settings
Cookies and similar technologies are used on this website for proper function of the website, for tracking performance analytics and for marketing purposes. We and some of our third-party providers may use cookie data for various purposes. Please review the cookie settings below and choose your preference.
Strictly Necessary: Used for the proper function of the website
Performance/Analytics: Used for monitoring website traffic and interactions
Because of the emergence of cloud services, a broad range of storage choices are now easily available to fulfill the different demands of both organizations and people. These storage alternatives have been designed to meet a range of requirements, including performance, scalability, durability, and price.
Built on Azure Blob Storage, Azure Data Lake Storage Gen2 is a suite of features for big data analytics. Azure Data Lake Storage Gen1 and Azure Blob Storage's capabilities are combined in Data Lake Storage Gen2. For instance, Data Lake Storage Gen2 offers scale, file-level security, and file system semantics.
Using existing storage resources optimally is key to being able to capture the right data over time. Increased storage space availability. The compression of transaction data older than three days can free up to 50% more storage space in your Dynatrace Managed Cluster. Data compression is completed on June 12.
At this scale, we can gain a significant amount of performance and cost benefits by optimizing the storage layout (records, objects, partitions) as the data lands into our warehouse. We built AutoOptimize to efficiently and transparently optimize the data and metadata storage layout while maximizing their cost and performance benefits.
Both categories share common requirements, such as high throughput and high availability. After selecting a mode, users can interact with APIs without needing to worry about the underlying storage mechanisms and counting methods. The table below provides a detailed overview of the diverse requirements across these two categories.
Dynatrace Managed now available on the Google Cloud Platform. We’re currently adding individual mount points for different storage types and separate disk setup for each of these storage types. The post Dynatrace Managed now available on all major cloud platforms appeared first on Dynatrace blog.
The certification results are now publicly available. The calculations and methodology used are in line with the best available scientific approach, as well as with relevant reporting requirements. Storage calculations assume that one terabyte consumes 1.2 A CPU operating at 100% utilization consumes power equal to its TDP.
Most of the use cases in these two broad categories benefit from the flexibility that comes from multiple available sources of business data. Reduced storage and query overhead for business use cases. Sensitive business data is separated from IT observability data. Improved data management. Simplified and enhanced analytics efficiency.
Dynatrace Managed is intrinsically highly available as it stores three copies of all events, user sessions, and metrics across its cluster nodes. Our Premium High Availability comes with the following features: Active-active deployment model for optimum hardware utilization. Dynatrace news. Minimized cross-data center network traffic.
The Grail™ data lakehouse provides fast, auto-indexed, schema-on-read storage with massively parallel processing (MPP) to deliver immediate, contextualized answers from all data at scale. By prioritizing observability, organizations can ensure the availability, performance, and security of business-critical applications.
Disclaimer: This publication may include references to the planned testing, release, and/or availability of Dynatrace products and services. Drive efficiency and get more value out your logs with this predictable pricing model while youre building your log analytics practices.
This dual-path approach leverages Kafkas capability for low-latency streaming and Icebergs efficient management of large-scale, immutable datasets, ensuring both real-time responsiveness and comprehensive historical data availability.
Unlike full backups that duplicate everything, incremental backups store only changes since the last save, reducing storage needs and speeding up recovery. Key Benefits: Smaller Storage Footprint: Saves only modified data, cutting down backup size. What new features are available for handling JSON data in PostgreSQL 17?
Message brokers handle validation, routing, storage, and delivery, ensuring efficient and reliable communication. Its design prioritizes high availability and efficient data transfer with minimal overhead, making it a practical choice for handling real-time data pipelines and distributed event processing. What is RabbitMQ?
High performance, query optimization, open source and polymorphic data storage are the major Greenplum advantages. Polymorphic Data Storage. Greenplum’s polymorphic data storage allows you to control the configuration for your table and partition storage with the freedom to execute and compress files within it at any time.
A distributed storage system is foundational in today’s data-driven landscape, ensuring data spread over multiple servers is reliable, accessible, and manageable. Understanding distributed storage is imperative as data volumes and the need for robust storage solutions rise.
There are a wealth of options on how you can approach storage configuration in Percona Operator for PostgreSQL , and in this blog post, we review various storage strategies — from basics to more sophisticated use cases. For example, you can choose the public cloud storage type – gp3, io2, etc, or set file system.
MongoDB offers several storage engines that cater to various use cases. The default storage engine in earlier versions was MMAPv1, which utilized memory-mapped files and document-level locking. The newer, pluggable storage engine, WiredTiger, addresses this by using prefix compression, collection-level locking, and row-based storage.
ScaleGrid’s MySQL, PostgreSQL and Redis™ solutions on DigitalOcean are competitively priced starting at just $15/GB, the same as DigitalOcean’s Managed Database solution, but offer on average 30% more storage for the same price.
Today along with their team, we will see how pvc-autoresizer can automate storage scaling for MongoDB clusters on Kubernetes. Our goal is to automate storage scaling when our disk reaches a certain threshold of use and simultaneously reduce the amount of alert noise related to that. kubectl annotate pvc --all resize.topolvm.io/storage_limit="100Gi"
Data storage and distribution through HollowFeeds Netflix Hollow is an Open Source java library and toolset for disseminating in-memory datasets from a single producer to many consumers for high performance read-only access. The results are returned in a standardized format, ensuring easy support for futureUIs.
Limited data availability constrains value creation. Teams have introduced workarounds to reduce storage costs. Additionally, efforts such as lowered data retention times, two-tiered storage systems, shaky index management, sampled data, and data pipelines reduce the overall amount of stored data.
JSONB storage has some drawbacks vs. traditional columns: PostreSQL does not store column statistics for JSONB columns. JSONB storage results in a larger storage footprint. JSONB storage does not deduplicate the key names in the JSON. If that doesn’t work, the data is moved to out-of-line storage.
This architecture offers rich data management and analytics features (taken from the data warehouse model) on top of low-cost cloud storage systems (which are used by data lakes). This decoupling ensures the openness of data and storage formats, while also preserving data in context. Grail is built for such analytics, not storage.
This means you no longer have to provision, scale, and maintain servers to run your applications, databases, and storage systems. Speed is next; serverless solutions are quick to spin up or down as needed, and there are no delays due to limited storage or resource access. AWS offers four serverless offerings for storage.
That’s because it does not require any pre-prepared schemas, and access to cold/hot storage is fully automatic and with zero latency. Dynatrace analytics capabilities, powered by hypermodal AI , enable executives to drive improved availability , strengthened security compliance , and heightened confidence in AI initiatives.
Implementing clustering and quorum queues in RabbitMQ significantly improves load distribution and data redundancy, ensuring high availability and fault tolerance for messaging services. Classic queues can be used in clusters, emphasizing their behavior during node failures, particularly regarding durability and availability.
With more organizations taking the multicloud plunge, monitoring cloud infrastructure is critical to ensure all components of the cloud computing stack are available, high-performing, and secure. Website monitoring examines a cloud-hosted website’s processes, traffic, availability, and resource use. Cloud storage monitoring.
Streamline privacy requirements with flexible retention periods Data retention is a critical aspect of data handling, and it’s not just about privacy compliance—it’s about having the flexibility to optimize data storage times in Grail for your Dynatrace use cases. Other data types will be available soon). What’s next?
To make data count and to ensure cloud computing is unabated, companies and organizations must have highly available databases. This guide provides an overview of what high availability means, the components involved, how to measure high availability, and how to achieve it. How does high availability work?
Optimize cost and availability while staying compliant Observability data like logs and metrics provide automated answers, root cause detection, and security issues. This means compromising between keeping data available as long as possible for analysis while juggling the costs and overhead of storage, archiving, and retrieval.
Central to this infrastructure is our use of multiple online distributed databases such as Apache Cassandra , a NoSQL database known for its high availability and scalability. This flexibility allows our Data Platform to route different use cases to the most suitable storage system based on performance, durability, and consistency needs.
But this also caused storage challenges like disk failures and data recovery. This architecture ensures high availability and stability of the data while significantly enhancing system performance and data recovery capabilities. Changing to ClickHouse made our query performance faster and greatly cut our costs.
Masking at storage: Data is persistently masked upon ingestion into Dynatrace. Leverage three masking layers Masking at capture and masking at storage operations exclude targeted sensitive data points. Open the available tabs to explore and easily tailor your data privacy settings.
Managing storage and performance efficiently in your MySQL database is crucial, and general tablespaces offer flexibility in achieving this. In contrast to the single system tablespace that holds system tables by default, general tablespaces are user-defined storage containers for multiple InnoDB tables.
High availability (HA) minimizes downtime for Percona Monitoring and Management (PMM) during hardware failures, in times of disaster recovery, or increased usage of the tool. It’s not just about extra storage, RAM, or CPU but rather having redundant systems ready to take over seamlessly, like […]
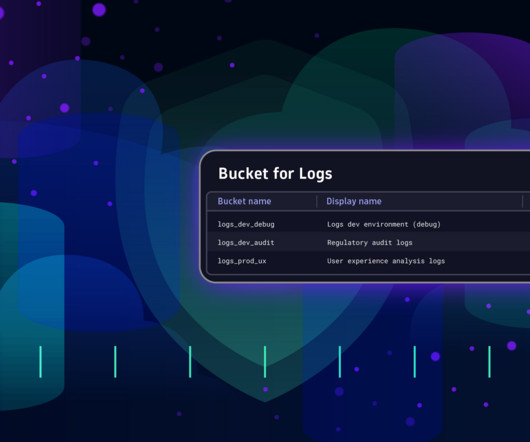
This allows you to create flexible and powerful log storage configurations on any level by utilizing the unique autodiscovery capabilities of Dynatrace OneAgent or a custom setup. It’s delivered in three parts: New log storage configuration is available in Dynatrace version 1.252 and requires OneAgent 1.243+.
Secondly, determining the correct allocation of resources (CPU, memory, storage) to each virtual machine to ensure optimal performance without over-provisioning can be difficult. Therefore, we have redesigned this extension from scratch, replacing the previously available WMI-based extension.
Infrastructure as a service (IaaS) handles compute, storage, and network resources. Increased availability. Because FaaS is a cloud-native approach, it makes great use of multisite cloud architecture to improve availability and reliability. But how does FaaS fit in? Software as a service (SaaS) delivers on-demand applications.
In this post, we outline the best way to host MySQL on Azure , including managed solutions, instance types, high availability replication, backup, and disk types to use to optimize your cloud database performance. High Availability Deployment. So, how do we configure high availability for MySQL on Azure?
Since database hosting is more dependent on memory (RAM) than storage, we are going to compare various instance sizes ranging from just 1GB of RAM up to 64GB of RAM so you can see how costs vary across different application workloads. Is my database cluster still highly available? DigitalOcean using the below instance types: AWS.
In most data storage models, indexing engines enable faster access to query logs. But indexing requires schema management and additional storage to be effective, which adds cost and overhead. This can vastly reduce an organization’s storage costs and improve data efficiency. The Dynatrace difference, powered by Grail.
Hardware - servers/storage hardware/software faults such as disk failure, disk full, other hardware failures, servers running out of allocated resources, server software behaving abnormally, intra DC network connectivity issues, etc. . – this is addressed through monitoring and redundancy. Redundancy by building additional data centers.
Logs are immediately available for troubleshooting, security investigations, and auditing, becoming integral to the platform alongside traces and metrics. The dashboard tracks a histogram chart of total storage utilized with logs daily. You can see in a table retention periods by the number of logs and storage they consumed.
We organize all of the trending information in your field so you don't have to. Join 5,000+ users and stay up to date on the latest articles your peers are reading.
You know about us, now we want to get to know you!
Let's personalize your content
Let's get even more personalized
We recognize your account from another site in our network, please click 'Send Email' below to continue with verifying your account and setting a password.


Let's personalize your content