This site uses cookies to improve your experience. To help us insure we adhere to various privacy regulations, please select your country/region of residence. If you do not select a country, we will assume you are from the United States. Select your Cookie Settings or view our Privacy Policy and Terms of Use.
Cookie Settings
Cookies and similar technologies are used on this website for proper function of the website, for tracking performance analytics and for marketing purposes. We and some of our third-party providers may use cookie data for various purposes. Please review the cookie settings below and choose your preference.
Used for the proper function of the website
Used for monitoring website traffic and interactions
Cookie Settings
Cookies and similar technologies are used on this website for proper function of the website, for tracking performance analytics and for marketing purposes. We and some of our third-party providers may use cookie data for various purposes. Please review the cookie settings below and choose your preference.
Strictly Necessary: Used for the proper function of the website
Performance/Analytics: Used for monitoring website traffic and interactions
Expectations for networkmonitoring In today’s digital landscape, businesses rely heavily on their IT infrastructure to deliver seamless services to customers. However, network issues can lead to significant downtime, affecting user experience and business operations.
Current synthetic capabilities Dynatrace Synthetic Monitoring is a powerful tool that provides insight into the health of your applications around the clock and as they’re perceived by your end users worldwide. Are all network devices up and running, and is the network providing reliable and swift access to your systems?
Traditional insight into HTTP monitor execution details For nearly two thousand Dynatrace customers, Dynatrace Synthetic HTTP monitors provide insights into the health of monitored endpoints worldwide and around the clock. It now fully supports not only NetworkAvailabilityMonitors but also HTTP synthetic monitors.
Dynatrace integrates application performance monitoring (APM), infrastructure monitoring, and real-user monitoring (RUM) into a single platform, with its Foundation & Discovery mode offering a cost-effective, unified view of the entire infrastructure, including non-critical applications previously monitored using legacy APM tools.
Managing SNMP devices at scale can be challenging SNMP (Simple Network Management Protocol) provides a standardized framework for monitoring and managing devices on IP networks. Its simplicity, scalability, and compatibility with a wide range of hardware make it an ideal choice for network management across diverse environments.
For cloud operations teams, network performance monitoring is central in ensuring application and infrastructure performance. If the network is sluggish, an application may also be slow, frustrating users. Worse, a malicious attacker may gain access to the network, compromising sensitive application data.
In this blog post, we look at these enhancements, exploring methods for monitoring your Kubernetes environment and showcasing how modern dashboards can transform your data. An example of this is shown in the video above, where we incorporated network-related metrics into the Kubernetes cluster dashboard.
By Alok Tiagi , Hariharan Ananthakrishnan , Ivan Porto Carrero and Keerti Lakshminarayan Netflix has developed a network observability sidecar called Flow Exporter that uses eBPF tracepoints to capture TCP flows at near real time. Without having network visibility, it’s difficult to improve our reliability, security and capacity posture.
In September, we announced the availability of the Dynatrace Software Intelligence Platform on Microsoft Azure as a SaaS solution and natively in the Azure portal. Today, we are excited to provide an update that Dynatrace SaaS on Azure is now generally available (GA) to the public through Dynatrace sales channels. Dynatrace news.
If you run several web servers in your organization or even public web servers on the internet, you need some kind of monitoring. For that reason, we use monitoring tools. And there are a lot of monitoring tools available providing all kinds of features and concepts.
In the final post of this series, we will review the last solution, Patroni by Zalando, and compare all three at the end so you can determine which high availability framework is best for your PostgreSQL hosting deployment. Managing High Availability in PostgreSQL – Part I: PostgreSQL Automatic Failover. Network Isolation Tests.
Whether you’re a seasoned IT expert or a marketing professional looking to improve business performance, understanding the data available to you is essential. With Dashboards , you can monitor business performance, user interactions, security vulnerabilities, IT infrastructure health, and so much more, all in real time.
The Dynatrace Software Intelligence Platform gives you a complete Infrastructure Monitoring solution for the monitoring of cloud platforms and virtual infrastructure, along with log monitoring and AIOps. Ensure high quality network traffic by tracking DNS requests out-of-the-box. What’s next.
In fact, according to a Dynatrace global survey of 1,300 CIOs , 99% of enterprises utilize a multicloud environment and seven cloud monitoring solutions on average. What is cloud monitoring? Cloud monitoring is a set of solutions and practices used to observe, measure, analyze, and manage the health of cloud-based IT infrastructure.
Dynatrace Managed is intrinsically highly available as it stores three copies of all events, user sessions, and metrics across its cluster nodes. The network latency between cluster nodes should be around 10 ms or less. Near-zero RPO and RTO—monitoring continues seamlessly and without data loss in failover scenarios.
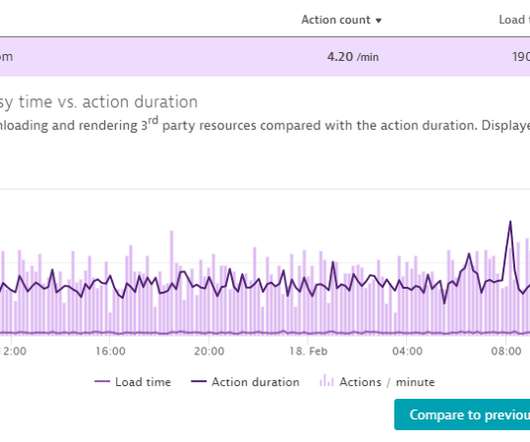
Activate Davis AI to analyze charts within seconds Davis AI can help you expand your dashboards and dive deeper into your available data to extract additional information. For example, if you’re monitoringnetwork traffic and the average over the past 7 days is 500 Mbps, the threshold will adapt to this baseline.
Managing High Availability (HA) in your PostgreSQL hosting is very important to ensuring your database deployment clusters maintain exceptional uptime and strong operational performance so your data is always available to your application. Effective management of failover and switchover operations is crucial for high availability.
Constantly monitoring infrastructure health state and making ongoing optimizations are essential for Ops teams, SREs (site-reliability engineers), and IT admins. Quick and easy network infrastructure monitoring. Tired of constantly switching between all your monitoring tools? Start monitoring in minutes.
Digital experience monitoring (DEM) is crucial for organizations to meet this demand and succeed in today’s competitive digital economy. DEM solutions monitor and analyze the quality of digital experiences for users across digital channels. The time taken to complete the page load.
The nirvana state of system uptime at peak loads is known as “five-nines availability.” In its pursuit, IT teams hover over system performance dashboards hoping their preparations will deliver five nines—or even four nines—availability. But is five nines availability attainable? Downtime per year. 90% (one nine).
Monitoring modern IT infrastructure is difficult, sometimes impossible, without advanced networkmonitoring tools. While the market is saturated with many Network Administrator support solutions, Dynatrace can help you analyze the impact on your organization in an automated manner. How SNMP traps help detect problems.
Real-time monitoring : The periodic reports from cloud service providers lack real-time monitoring and actionable insights, limiting IT teams’ ability to make immediate adjustments to reduce carbon footprints. The certification results are now publicly available. Static assumptions are: Local network traffic uses 0.12
We’re happy to announce the General Availability of cross-environment dashboarding capabilities (having released this functionality in an Early Adopter release with Dynatrace version 1.172 back in June 2019). Monitoring the enterprise cloud poses many challenges when it comes to scale. Dynatrace news.
Infrastructure monitoring is the process of collecting critical data about your IT environment, including information about availability, performance and resource efficiency. Many organizations respond by adding a proliferation of infrastructure monitoring tools, which in many cases, just adds to the noise. Dynatrace news.
Modern applications—enterprise and consumer—increasingly depend on third-party services to create a fast, seamless, and highly available experience for the end-user. As a result, API monitoring has become a must for DevOps teams. So what is API monitoring? What is API Monitoring? The need for API monitoring.
An hourly rate for Infrastructure Monitoring The Dynatrace Platform Subscription (DPS) offers a flat rate for Infrastructure Monitoring , providing observability for cloud platforms, containers, networks, and data center technologies with no limits on host memory and with AIOps included.
Having released this functionality in an Early Adopter Release with OneAgent version 1.173 and Dynatrace version 1.174 back in August 2019, we’re now happy to announce the General Availability of OneAgent full-stack monitoring for Linux on the IBM Z platform, sometimes informally referred to as Z/Linux. What’s included.
With the world’s increased reliance on digital services and the organizational pressure on IT teams to innovate faster, the need for DevOps monitoring tools has grown exponentially. But when and how does DevOps monitoring fit into the process? And how do DevOps monitoring tools help teams achieve DevOps efficiency?
With almost 100 public locations worldwide, Dynatrace Synthetic Monitoring enables 24/7 measurement of the availability and performance of your applications as experienced by your customers and coworkers worldwide. With Dynatrace private Synthetic locations, we make the monitoring of internal applications easy! What’s next.
As businesses compete for customer loyalty, it’s critical to understand the difference between real-user monitoring and synthetic user monitoring. However, not all user monitoring systems are created equal. What is real user monitoring? Real-time monitoring of user application and service interactions.
Automated AI-powered analytics are necessary to match the scale of monitoring these enterprises require. Our journey began in 2019 with the introduction of the Dynatrace Citrix monitoring extension. Listen, learn, improve, and repeat The latest update to the Citrix monitoring extension is now available.
Log monitoring, log analysis, and log analytics are more important than ever as organizations adopt more cloud-native technologies, containers, and microservices-based architectures. A log is a detailed, timestamped record of an event generated by an operating system, computing environment, application, server, or network device.
Digital experience monitoring (DEM) allows an organization to optimize customer experiences by taking into account the context surrounding digital experience metrics. What is digital experience monitoring? Primary digital experience monitoring tools.
In today's digital landscape, businesses heavily rely on content delivery networks (CDNs) to ensure efficient and reliable delivery of their web content to users across the globe. However, the extended infrastructure of CDNs requires diligent monitoring to ensure optimal performance and identify potential issues.
It’s all monitored remotely ! More metrics, more data We have improved performance KPI collection and added new metrics and entities, like: System Memory pools Jobs Job queues ASP and disks Output queues and spooling files Message queues Network Subsystems Each entity has more metadata to help you identify and understand its configuration.
Dynatrace OneAgent is great for monitoring the full stack. There are certain situations when an agent based approach isn’t possible, such as with network or storage devices, or a very old OS. While this will give you a lot of information about the health of these components, sometimes a simple synthetic monitor is sufficient.
Implementing clustering and quorum queues in RabbitMQ significantly improves load distribution and data redundancy, ensuring high availability and fault tolerance for messaging services. Classic queues can be used in clusters, emphasizing their behavior during node failures, particularly regarding durability and availability.
With today’s high expectations for the speed and availability of applications, you need a deep understanding of real user experiences to make the best business decisions. Dynatrace Synthetic Monitoring ensures that your application is available and performs well from anywhere in the world to meet your SLAs. Dynatrace news.
By using AIOps to monitor events system-wide, teams can automate an array of common security processes, including application monitoring, threat intelligence analysis, and security incident response. This blog originally appeared in Federal News Network. When we protect our systems, we’re also protecting them.
IT infrastructure is the heart of your digital business and connects every area – physical and virtual servers, storage, databases, networks, cloud services. This shift requires infrastructure monitoring to ensure all your components work together across applications, operating systems, storage, servers, virtualization, and more.
But this approach introduced new complexity and a need for more advanced cloud monitoring capabilities. Dynatrace’s cloud monitoring capabilities are helping Porsche Informatik to simplify complexity and drive improved digital experiences for customers. Simplifying complexity with cloud monitoring.
Don’t worry, when it comes to SAP monitoring, Dynatrace has you covered. Dynatrace ActiveGate extensions allow you to integrate Dynatrace monitoring with any remote technology that exposes an interface. Today we’re proud to announce that we’ve extended our SAP monitoring capabilities to support SAP HANA databases.
That is why you must treat monitoring of these 3 rd party APIs with the same priority as your own code or platforms your code runs on, using something like Dynatrace RUM to do so. Dynatrace Real User Monitoring (RUM) automatically monitors your 3rd, 1st party and CDN resources loaded by your applications.
But this approach introduced new complexity and a need for more advanced cloud monitoring capabilities. Dynatrace’s cloud monitoring capabilities are helping Porsche Informatik to simplify complexity and drive improved digital experiences for customers. Simplifying complexity with cloud monitoring.
We organize all of the trending information in your field so you don't have to. Join 5,000+ users and stay up to date on the latest articles your peers are reading.
You know about us, now we want to get to know you!
Let's personalize your content
Let's get even more personalized
We recognize your account from another site in our network, please click 'Send Email' below to continue with verifying your account and setting a password.


Let's personalize your content