This site uses cookies to improve your experience. To help us insure we adhere to various privacy regulations, please select your country/region of residence. If you do not select a country, we will assume you are from the United States. Select your Cookie Settings or view our Privacy Policy and Terms of Use.
Cookie Settings
Cookies and similar technologies are used on this website for proper function of the website, for tracking performance analytics and for marketing purposes. We and some of our third-party providers may use cookie data for various purposes. Please review the cookie settings below and choose your preference.
Used for the proper function of the website
Used for monitoring website traffic and interactions
Cookie Settings
Cookies and similar technologies are used on this website for proper function of the website, for tracking performance analytics and for marketing purposes. We and some of our third-party providers may use cookie data for various purposes. Please review the cookie settings below and choose your preference.
Strictly Necessary: Used for the proper function of the website
Performance/Analytics: Used for monitoring website traffic and interactions
As modern multicloud environments become more distributed and complex, having real-time insights into applications and infrastructure while keeping data residency in local markets is crucial. As of October 2024, Dynatrace is available on Microsoft Azure Australia East region, enabling joint customers to maintain a local SaaS presence.
The nirvana state of system uptime at peak loads is known as “five-nines availability.” In its pursuit, IT teams hover over system performance dashboards hoping their preparations will deliver five nines—or even four nines—availability. But is five nines availability attainable? What is always-on infrastructure?
As HTTP and browser monitors cover the application level of the ISO /OSI model , successful executions of synthetic tests indicate that availability and performance meet the expected thresholds of your entire technological stack. Our script, available on GitHub , provides details. But is this all you need?
The rapid evolution of cloud technology continues to shape how businesses operate and compete. AWS’ recent recognition of Dynatrace as the 2024 AWS EMEA Technology Partner of the Year highlights the joint commitment to accelerate customer cloud transformation.
In September, we announced the availability of the Dynatrace Software Intelligence Platform on Microsoft Azure as a SaaS solution and natively in the Azure portal. Today, we are excited to provide an update that Dynatrace SaaS on Azure is now generally available (GA) to the public through Dynatrace sales channels. Dynatrace news.
At Dynatrace, we’re constantly striving to come up with solutions that help you better understand the health of your infrastructure. Windows-based infrastructure monitoring. There can be thousands of services depending on which technology you use and which aspects of monitoring you’re interested in. Dynatrace news.
To solve this problem , Dynatrace offers a fully automated approach to infrastructure and application observability including Kubernetes control plane, deployments, pods, nodes, and a wide array of cloud-native technologies. None of this complexity is exposed to application and infrastructure teams.
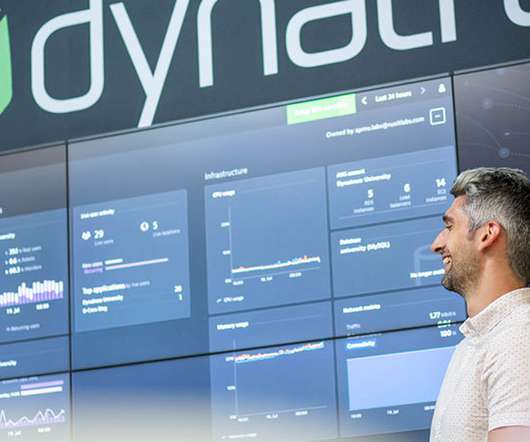
Infrastructure monitoring is the process of collecting critical data about your IT environment, including information about availability, performance and resource efficiency. Many organizations respond by adding a proliferation of infrastructure monitoring tools, which in many cases, just adds to the noise. Dynatrace news.
As organizations adopt more cloud-native technologies, the risk—and consequences—of cyberattacks are also increasing. Through this integration, Dynatrace enriches data collected by Microsoft Sentinel to provide organizations with enhanced data insights in context of their full technology stack.
An hourly rate for Infrastructure Monitoring The Dynatrace Platform Subscription (DPS) offers a flat rate for Infrastructure Monitoring , providing observability for cloud platforms, containers, networks, and data center technologies with no limits on host memory and with AIOps included.
already address SNMP, WMI, SQL databases, and Prometheus technologies, serving the monitoring needs of hundreds of Dynatrace customers. are technologically very different, Python and JMX extensions designed for Extension Framework 1.0 Extensions can monitor virtually any type of technology in your environment. Extensions 2.0
Dynatrace with Red Hat OpenShift monitoring stands out for the following reasons: With infrastructure health monitoring and optimization, you can assess the status of your infrastructure at a glance to understand resource consumption and thus optimize resource allocation for cost efficiency.
In October 2021, Dynatrace announced the availability of the Dynatrace Software Intelligence Platform on Google Cloud as a software as a service (SaaS) solution. Today, we are excited to announce this SaaS delivery model is now generally available (GA) to the public through Dynatrace sales channels. Dynatrace news.
Infrastructure and operations teams must maintain infrastructure health for IT environments. With the Infrastructure & Operations app ITOps teams can quickly track down performance issues at their source, in the problematic infrastructure entities, by following items indicated in red.
.” While this methodology extends to every layer of the IT stack, infrastructure as code (IAC) is the most prominent example. Here, we’ll tackle the basics, benefits, and best practices of IAC, as well as choosing infrastructure-as-code tools for your organization. What is infrastructure as code? Consistency.
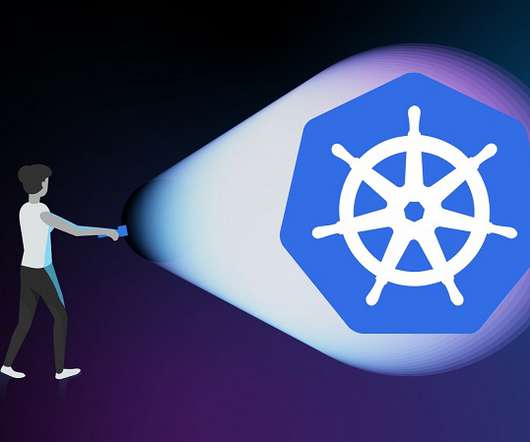
In Kubernetes environments, operating and successfully running your production applications and microservices requires getting additional insights into your Kubernetes infrastructure including the cluster, nodes, and pods that encapsulate and run the apps. Get instant operational insights into your Kubernetes pods and namespaces.
The end goal, of course, is to optimize the availability of organizations’ software. Cloud technology complexity with billions of dependencies has outgrown human comprehension and requires AI to analyze and conclude. Dynatrace AI increases efficiency by magnitudes and prevents alert storms.
Dynatrace ActiveGate extensions allow you to integrate Dynatrace monitoring with any remote technology that exposes an interface. However, for non-SAP engineers, the amount of available information can be overwhelming—it’s not always clear where to look for answers when you have questions about the performance of your SAP HANA database.
This blog post explains how Dynatrace simplifies log ingestion, whether youre onboarding logs from your infrastructure using OneAgent, cloud services using log forwarding, or driving open-source standardization leveraging OpenTelemetry (OTel), Fluent Bit, or any other API-based ingestion methods.
More than 90% of enterprises now rely on a hybrid cloud infrastructure to deliver innovative digital services and capture new markets. That’s because cloud platforms offer flexibility and extensibility for an organization’s existing infrastructure. Dynatrace news. With public clouds, multiple organizations share resources.
Dynatrace OpenPipeline is a new stream processing technology that ingests and contextualizes data from any source. Track business metrics, key performance indicators (KPIs), and service level objectives (SLOs) — automatically and in context with IT infrastructure and services — to promote collaboration between business and IT teams.
This is partly due to the complexity of instrumenting and analyzing emissions across diverse cloud and on-premises infrastructures. Integration with existing systems and processes : Integration with existing IT infrastructure, observability solutions, and workflows often requires significant investment and customization.
Developed first at SoundCloud, the project became part of the Cloud Native Computing Foundation (CNCF) and has steadily become the industry standard for both containerized infrastructure and classic implementation scenarios , especially within Kubernetes clusters. You can query for metrics and transform results to gain desired insights.
In those cases, what should you do if you want to be proactive and ensure that your infrastructure is always up and running? Heading up the Platform Extension Services team at Dynatrace, we’re the go-to team for anything that isn’t available out of the box. Easy and flexible infrastructure monitoring.
Boost your operational resilience: Combining availability and security is now essential. More technology, more complexity The benefits of cloud-native architecture for IT systems come with the complexity of maintaining real-time visibility into security compliance and risk posture.
Dynatrace Managed is intrinsically highly available as it stores three copies of all events, user sessions, and metrics across its cluster nodes. Our Premium High Availability comes with the following features: Active-active deployment model for optimum hardware utilization. Dynatrace news. Minimized cross-data center network traffic.
Having released this functionality in an Early Adopter Release with OneAgent version 1.173 and Dynatrace version 1.174 back in August 2019, we’re now happy to announce the General Availability of OneAgent full-stack monitoring for Linux on the IBM Z platform, sometimes informally referred to as Z/Linux. Host-performance measures.
While Kubernetes is still a relatively young technology, a large majority of global enterprises use it to run business-critical applications in production. Findings provide insights into Kubernetes practitioners’ infrastructure preferences and how they use advanced Kubernetes platform technologies. Java, Go, and Node.js
Red Hat OpenShift monitoring with Dynatrace stands out due to the following key aspects: Infrastructure health monitoring and optimization: Assess the status of your infrastructure at a glance, understand resource consumption, optimize resource allocation for cost-efficiency, and track software versions running within the Kubernetes environment.
OpenTelemetry provides a common set of tools, APIs, and SDKs to help collect observability signals from applications and infrastructure endpoints. All the needed components are available out of the box in the OpenTelemetry collector contrib distribution, which is included in the demo application. metrics from span data.
But there are other related components and processes (for example, cloud provider infrastructure) that can cause problems in applications running on Kubernetes. Dynatrace AWS monitoring gives you an overview of the resources that are used in your AWS infrastructure along with their historical usage. Monitoring your i nfrastructure.
Challenges The cloud network infrastructure that Netflix utilizes today consists of AWS services such as VPC, DirectConnect, VPC Peering, Transit Gateways, NAT Gateways, etc and Netflix owned devices. These metrics are visualized using Lumen , a self-service dashboarding infrastructure.
Its design prioritizes high availability and efficient data transfer with minimal overhead, making it a practical choice for handling real-time data pipelines and distributed event processing. It follows a push-based approach, ensuring messages are distributed to consumers as soon as they become available.
As organizations adopt more cloud-native technologies, infrastructure and application monitoring can get complex. When it comes to Microsoft Azure, it’s about understanding the application workloads and Azure infrastructure. For most organizations, Azure infrastructure is a critical part of a wider IT infrastructure.
But it’s not easy: to pull this off, VFX studios need to build and operate serious technical infrastructure (compute, storage, networking, and software licensing), otherwise known as a “ render farm.” Netflix production teams work with a global roster of VFX studios (both large and small) and their artists to create this amazing imagery.
These include traditional on-premises network devices and servers for infrastructure applications like databases, websites, or email. Without seeing syslog data in the context of your infrastructure, metrics, and transaction traces, you’re slowed down by manual work with siloed data. Setting up your first Environment ActiveGate?
If cloud-native technologies and containers are on your radar, you’ve likely encountered Docker and Kubernetes and might be wondering how they relate to each other. In a nutshell, they are complementary and, in part, overlapping technologies to create, manage, and operate containers. Dynatrace news. But first, some background.
As a close technology partner of GCP and a leader in Kubernetes monitoring, we’re excited to be a launch partner. Maintaining complete observability into applications and microservices, as well as the infrastructure they run on, is critical to ensuring the performance and availability of complex and distributed Kubernetes environments.
To make data count and to ensure cloud computing is unabated, companies and organizations must have highly available databases. This guide provides an overview of what high availability means, the components involved, how to measure high availability, and how to achieve it. How does high availability work?
Log management and analytics is an essential part of any organization’s infrastructure, and it’s no secret the industry has suffered from a shortage of innovation for several years. Limited data availability constrains value creation. Even in cases where all data is available, new challenges can arise.
As DevOps pioneer Patrick Debois first described it in 2009, DevOps is not a specific technology, but a tactical approach. ” One major challenge that contributes to these problems is siloing — the traditional separation of development and operations teams in terms of their priorities and the resources and insights available to them.
Containers enable developers to package microservices or applications with the libraries, configuration files, and dependencies needed to run on any infrastructure, regardless of the target system environment. This orchestration includes provisioning, scheduling, networking, ensuring availability, and monitoring container lifecycles.
Available directly from the AWS Marketplace , Dynatrace provides full-stack observability and AI to help IT teams optimize the resiliency of their cloud applications from the user experience down to the underlying operating system, infrastructure, and services.
The development of internal platform teams has taken off in the last three years, primarily in response to the challenges inherent in scaling modern, containerized IT infrastructures. Platform engineering best practices for delivering a highly available, secure, and resilient Internal Development Platform: Centralize and standardize.
We organize all of the trending information in your field so you don't have to. Join 5,000+ users and stay up to date on the latest articles your peers are reading.
You know about us, now we want to get to know you!
Let's personalize your content
Let's get even more personalized
We recognize your account from another site in our network, please click 'Send Email' below to continue with verifying your account and setting a password.


Let's personalize your content