This site uses cookies to improve your experience. To help us insure we adhere to various privacy regulations, please select your country/region of residence. If you do not select a country, we will assume you are from the United States. Select your Cookie Settings or view our Privacy Policy and Terms of Use.
Cookie Settings
Cookies and similar technologies are used on this website for proper function of the website, for tracking performance analytics and for marketing purposes. We and some of our third-party providers may use cookie data for various purposes. Please review the cookie settings below and choose your preference.
Used for the proper function of the website
Used for monitoring website traffic and interactions
Cookie Settings
Cookies and similar technologies are used on this website for proper function of the website, for tracking performance analytics and for marketing purposes. We and some of our third-party providers may use cookie data for various purposes. Please review the cookie settings below and choose your preference.
Strictly Necessary: Used for the proper function of the website
Performance/Analytics: Used for monitoring website traffic and interactions
When first working on a new site-speed engagement, you need to work out quickly where the slowdowns, blindspots, and inefficiencies lie. Google Analytics can show us individual slow pages, but doesn’t necessarily help us build a bigger picture of the site as a whole. See entry 6. Visualising the Data.
There are umpteen tools available to check the internet speed. SpeedTest, Speed from Cloudflare , Netflix's Fast , or if you use Google search , you can test the internet speed and its analytics. In macOS Monterey, Apple has released a command-line tool called networkQuality.
In this post, I wanted to share how I use Google Analytics together with Dynatrace to give me a more complete picture of my customers, and their experience across our digital channels. Google Analytics. Almost all marketers will be familiar with Google Analytics. Dynatrace – understanding customer experience. Thanks, Davis!
Google’s Core Web Vitals initiative was launched in May of 2020 and, since then, its role in Search has morphed and evolved as roll-outs have been made and feedback has been received. However, to this day, messaging from Google can seem somewhat unclear and, in places, even contradictory. Don’t have time to read 5,500+ words?
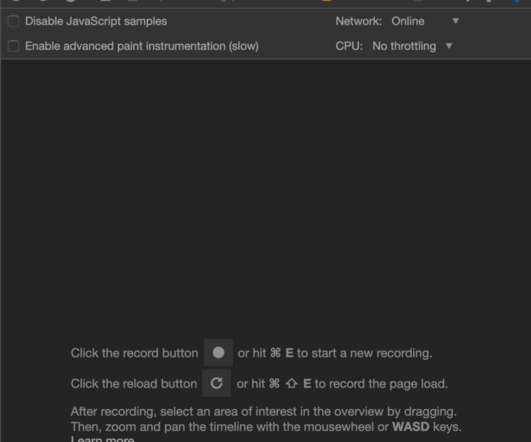
You’ve fired up Google Lighthouse from Chrome’s DevTools because everyone and their uncle uses it to evaluate performance. Except, don’t — at least not using Google Lighthouse as your sole proof. Google Lighthouse is merely one tool in a complete performance toolkit. That’s what we’re aiming for, after all!
How To Monitor And Optimize Google Core Web Vitals How To Monitor And Optimize Google Core Web Vitals Matt Zeunert 2024-04-16T10:00:00+00:00 2024-04-16T12:05:36+00:00 This article is sponsored by DebugBear Google’s Core Web Vitals initiative has increased the attention website owners need to pay to user experience.
Cloud-native environments bring speed and agility to software development and operations (DevOps) practices. But with that speed and agility comes new complications and complexity, all while maintaining performance and reliability with less than 1% down-time per year. Investing in automation and tooling to avoid toil. SRE vs DevOps?
I never thought I’d write an article in defence of DOMContentLoaded , but here it is… For many, many years now, performance engineers have been making a concerted effort to move away from technical metrics such as Load , and toward more user-facing, UX metrics such as Speed Index or Largest Contentful Paint. for the vast minority of sessions.
Effective application development requires speed and specificity. Cloud providers such as Google, Amazon Web Services, and Microsoft also followed suit with frameworks such as Google Cloud Functions , AWS Lambda , and Microsoft Azure Functions. Increased availability. Dynatrace news. How does function as a service work?
Performance, errors, and user experience Dynatrace has long understood the importance of performance as a foundational component of user experience and the impact that page speed and any friction introduced by errors have on user behavior. Get started Opportunity Insights is available with the Dynatrace Business Insights service.
Google has a pretty tight grip on the tech industry: it makes by far the most popular browser with the best DevTools, and the most popular search engine, which means that web developers spend most of their time in Chrome, most of their visitors are in Chrome, and a lot of their search traffic will be coming from Google. Chrome for iOS?
Great user experiences start with Core Web Vitals (CWVs) — a set of metrics defined by Google to help measure user experience at scale. They are part of Web Vitals , a quality standards initiative by Google that helps web developers deliver great user experiences. If sites take 6 seconds to load, bounce rates mushroom by 106%.
Dynatrace Synthetic Monitoring allows you to proactively monitor the availability of your public as well as your internal web applications and API endpoints from locations around the globe or important internal locations such as branch offices. These metrics are tightly connected to the perceived load speed of your application.
As a discipline, SRE focuses on improving software system reliability across key categories including availability, performance, latency, efficiency, capacity, and incident response. ” According to Google, “SRE is what you get when you treat operations as a software problem.” SRE focuses on automation.
You also might be required to capture syslog messages from cloud services on AWS, Azure, and Google Cloud related to resource provisioning, scaling, and security events. This speeds up your teams’ mean time to identify (MTTI) issues and repair (MTTR), increasing business resiliency to disruptions.
Answering Common Questions About Interpreting Page Speed Reports Answering Common Questions About Interpreting Page Speed Reports Geoff Graham 2023-10-31T16:00:00+00:00 2023-10-31T17:06:18+00:00 This article is sponsored by DebugBear Running a performance check on your site isn’t too terribly difficult. Can’t be perfect every time!
21 years later, in 2013, Google launched Brotli, a new algorithm that claims even greater improvement than Gzip! They were either running their own infrastructure and installing and deploying Brotli everywhere proved non-trivial, or they were using a CDN who didn’t have readily available support for the new algorithm. packet loss).
What Web Designers Can Do To Speed Up Mobile Websites. What Web Designers Can Do To Speed Up Mobile Websites. I recently wrote a blog post for a web designer client about page speed and why it matters. What I didn’t know before writing it was that her agency was struggling to optimize their mobile websites for speed.
And how can you verify this performance consistently across a multicloud environment that also uses Microsoft Azure and Google Cloud Platform frameworks? Storing frequently accessed data in faster storage, usually in-memory caching, improves data retrieval speed and overall system performance. Beyond
As a discipline, SRE focuses on improving software system reliability across key categories including availability, performance, latency, efficiency, capacity, and incident response. ” According to Google, “SRE is what you get when you treat operations as a software problem.” SRE focuses on automation.
To speed up release frequency, they’re investing in delivery-pipeline automation. The flip side of speeding up delivery, however, is that each software release comes with the risk of impacting your goals of availability, performance, or any business KPIs. Watch this talk about Automated SLO Management for more information.
Hundreds of thousands of companies use Google Cloud’s GKE to build and run their applications. Advancing a cool component to the mix, did you know Google Cloud does all the manual work and more with GKE Autopilot ?
Think of the KPIs that measure your team’s performance, your SRE SLOs, or how Google Search rankings are influenced by Core Web Vitals ; these measurements are derived from multiple raw metrics, processed into actionable insights. The metrics we have available are Action count and Error count. The Code tab displays the resulting query.
Keptn: A reference implementation of Google’s SRE principles. Software engineer Taras Tsugrii of Meta (formerly Facebook) paid Keptn a high compliment, saying it feels like a reference implementation of Google’s SRE principles , which are the search giant’s techniques for ensuring the integrity of its sites and services.
As a Software Engineer, the mind is trained to seek optimizations in every aspect of development and ooze out every bit of available CPU Resource to deliver a performing application. Considering all aspects and needs of current enterprise development, it is C++ and Java which outscore the other in terms of speed.
Keeping pace with modern digital transformation requires ensuring that applications are responsive, resilient, and always available amid increased complexity. Microservices-based architectures and software containers enable organizations to deploy and modify applications with unprecedented speed. availability.
However, setting the right parameters for Kubernetes clusters to ensure application availability, performance, and resilience while avoiding overspending isn’t a walk in the park. To illustrate how Akamas approach works for Kubernetes microservices applications the webinar, the example of Google Online Boutique is used during the webinar.
As organizations digitally transform, they’re also accelerating the speed of software delivery. These organizations rely heavily on performance, availability, and user satisfaction to drive sales and retain customers. AvailabilityAvailability SLO quantifies the expected level of service availability over a specific time period.
As a database tailored towards enterprise workloads, this provides the ability needed to explore large data sets along with the high performance achieved by paralleling the analytics across your available segment hosts. Greenplum is a great database choice for applications looking to mimic human abilities through smart machines.
Chrome’s DevTools suite contains some of the most powerful tools available to help you analyze and improve the speed of your website (or web app). Interpreting this information is a powerful tool, and allows you to use it in the way Google intended. They can also be the most overwhelming. To improve your site!
service availability with <50ms latency for an application with no revenue impact. For example, constant SLO violations of service availability for the check deposit application would create customer dissatisfaction leading to potential revenue impact. Let’s take service availability for example.
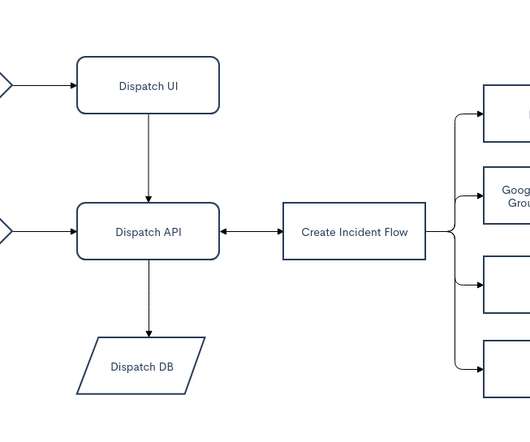
Building on past incidents to speed up the resolution of future incidents. Catalog, store and analyze our incident data to speed up resolution. status, title, description, priority, etc,) and Google Doc and Google Drive for managing data itself. Getting Started Dispatch is available now on the Netflix Open Source site.
If your website is loading slowly, thats bad for user experience and can also cause your site to rank lower in Google. Google has been working to address that recently by introducing LCP subparts , which tell you where page load delays are coming from. According to Google, you should aim to eliminate resource load delay entirely.
At this year’s Google Cloud Next conference, xMatters introduced Flow Designer , a visual designer that enables users to resolve issues without writing a single line of code. Whether you’re rolling back a release or applying a hotfix, Flow Designer increases speed and creates consistency in the delivery cycle. How is this done?
And if you absolutely have to have it on a device, most of them are available via Kindle as well. If you’re looking to read optimization ideas from one of the greatest minds in speed performance, look no further. and the Head Performance Engineer at Google. If these rules can be applied to improving speeds at Yahoo!
This integrated approach represents significant time savings, drastically reducing MTTI and speeding mean time to resolution (MTTR). A data lakehouse combines the structure and cost-efficiency of a data lake with the contextual and high-speed querying capabilities of a data warehouse.
Service-level objectives (SLOs) are a great tool to align business goals with the technical goals that drive DevOps (Speed of Delivery) and Site Reliability Engineering (SRE) (Ensuring Production Resiliency). This allows pulling or pushing mobile app ratings through the APIs that Google and Apple offer into Dynatrace. Availability.
Consider how AI-enabled chatbots such as ChatGPT and Google Bard help DevOps teams write code snippets or resolve problems in custom code without time-consuming human intervention. DevSecOps and ITOps teams can then perform tasks with accuracy at the speed a business requires. Operations. Applications and microservices monitoring.
However, getting reliable answers from observability data so teams can automate more processes to ensure speed, quality, and reliability can be challenging. This drive for speed has a cost: 22% of leaders admit they’re under so much pressure to innovate faster that they must sacrifice code quality.
The AOM board currently includes Amazon, Apple, ARM, Cisco, Facebook, Google, IBM, Intel, Microsoft, Mozilla, Netflix, Nvidia, and Samsung, and many companies joined as promoter members. The encoder can typically be improved years after the standard has been frozen including varying speed and quality trade-offs.
If you're using Linux, you likely already have eBPF available on your systems whether you know it or not, as it was included in the kernel several years ago. Meta, Isovalent, Google) and academia (e.g., Authors: Brendan Gregg, Intel; Daniel Borkmann, Isovalent; Joe Stringer, Isovalent; KP Singh, Google.
With Dynatrace version 1.194, the following new metrics are immediately available on your Multidimensional analysis, Waterfall analysis, and User action details pages: First paint : The time spent from navigation to when the browser renders the first non-default background element.
While speeding up development processes and reducing complexity does make the lives of Kubernetes operators easier, the inherent abstraction and automation can lead to new types of errors that are difficult to find, troubleshoot, and prevent. The Kubernetes experience. Others are almost self-configuring?
The most beautiful, spectacular site in the world won’t do anyone much good if people can’t find it on Google (or Bing, or DuckDuckGo). Work out what your priorities are, how you can measure progress, and the limitations of the available data. Google Keyword Planner. Google Trends. Google Mobile-Friendly Test.
We organize all of the trending information in your field so you don't have to. Join 5,000+ users and stay up to date on the latest articles your peers are reading.
You know about us, now we want to get to know you!
Let's personalize your content
Let's get even more personalized
We recognize your account from another site in our network, please click 'Send Email' below to continue with verifying your account and setting a password.


Let's personalize your content