This site uses cookies to improve your experience. To help us insure we adhere to various privacy regulations, please select your country/region of residence. If you do not select a country, we will assume you are from the United States. Select your Cookie Settings or view our Privacy Policy and Terms of Use.
Cookie Settings
Cookies and similar technologies are used on this website for proper function of the website, for tracking performance analytics and for marketing purposes. We and some of our third-party providers may use cookie data for various purposes. Please review the cookie settings below and choose your preference.
Used for the proper function of the website
Used for monitoring website traffic and interactions
Cookie Settings
Cookies and similar technologies are used on this website for proper function of the website, for tracking performance analytics and for marketing purposes. We and some of our third-party providers may use cookie data for various purposes. Please review the cookie settings below and choose your preference.
Strictly Necessary: Used for the proper function of the website
Performance/Analytics: Used for monitoring website traffic and interactions
Dynatrace on Microsoft Azure allows enterprises to streamline deployment, gain critical insights, and automate manual processes. As of October 2024, Dynatrace is available on Microsoft Azure Australia East region, enabling joint customers to maintain a local SaaS presence. The result?
These innovations promise to streamline operations, boost efficiency, and offer deeper insights for enterprises using AWS services. This integration simplifies the process of embedding Dynatrace full-stack observability directly into custom Amazon Machine Images (AMIs).
A good Kubernetes SLO strategy helps teams manage and make containerized workloads more efficient. However, due to the fact that they boil down selected indicators to single values and track error budget levels, they also offer a suitable way to monitor optimization processes while aligning on single values to meet overall goals.
Manual processes are prone to human error and inefficiencies which can lead to compliance gaps, posing substantial risks to financial institutions. Any incident can negatively impact service availability, and even a swift reaction might not prevent financial, reputational, or societal damage from happening.
Dynatrace OpenPipeline is a new stream processing technology that ingests and contextualizes data from any source. Business process monitoring and optimization. Most of the use cases in these two broad categories benefit from the flexibility that comes from multiple available sources of business data.
Boost your operational resilience: Combining availability and security is now essential. Carefully planning and integrating new processes and tools is critical to ensuring compliance without disrupting daily operations. million to $5 million annually in increased developer efficiency with our vulnerability and exposure offering alone.
A production bug is the worst; besides impacting customer experience, you need special access privileges, making the process far more time-consuming. It also makes the process risky as production servers might be more exposed, leading to the need for real-time production data. This cumbersome process should not be the norm.
Adopting AI to enhance efficiency and boost productivity is critical in a time of exploding data, cloud complexities, and disparate technologies. The Grail™ data lakehouse provides fast, auto-indexed, schema-on-read storage with massively parallel processing (MPP) to deliver immediate, contextualized answers from all data at scale.
Sometimes, introducing new IT solutions is delayed or canceled because a single business unit can’t manage the operating costs alone, and per-department cost insights that could facilitate cost sharing aren’t available. Costs and their origin are transparent, and teams are fully accountable for the efficient usage of cloud resources.
Both categories share common requirements, such as high throughput and high availability. Eventually Consistent Global Counter While some users may accept the limitations of a Best-Effort counter, others opt for precise counts, durability and global availability.
Ensuring smooth operations is no small feat, whether you’re in charge of application performance, IT infrastructure, or business processes. Activate Davis AI to analyze charts within seconds Davis AI can help you expand your dashboards and dive deeper into your available data to extract additional information.
This feature, available by default for OTel-instrumented services, allows users a standard way to measure and compare response times across different services consistently. These histograms are more efficient in carrying a high dynamic range of different values and ensure that the relative error for every bucket remains stable.
In this blog post, we will see how Dynatrace harnesses the power of observability and analytics to tailor a new experience to easily extend to the left, allowing developers to solve issues faster, build more efficient software, and ultimately improve developer experience!
This demand for rapid innovation is propelling organizations to adopt agile methodologies and DevOps principles to deliver software more efficiently and securely. But when and how does DevOps monitoring fit into the process? And how do DevOps monitoring tools help teams achieve DevOps efficiency? Lost efficiency.
Managing High Availability (HA) in your PostgreSQL hosting is very important to ensuring your database deployment clusters maintain exceptional uptime and strong operational performance so your data is always available to your application. Effective management of failover and switchover operations is crucial for high availability.
A Data Movement and Processing Platform @ Netflix By Bo Lei , Guilherme Pires , James Shao , Kasturi Chatterjee , Sujay Jain , Vlad Sydorenko Background Realtime processing technologies (A.K.A stream processing) is one of the key factors that enable Netflix to maintain its leading position in the competition of entertaining our users.
By leveraging Dynatrace observability on Red Hat OpenShift running on Linux, you can accelerate modernization to hybrid cloud and increase operational efficiencies with greater visibility across the full stack from hardware through application processes. Dynatrace observability is available for Red Hat OpenShift on IBM Power.
The business process observability challenge Increasingly dynamic business conditions demand business agility; reacting to a supply chain disruption and optimizing order fulfillment are simple but illustrative examples. Most business processes are not monitored. First and foremost, it’s a data problem.
The application consists of several microservices that are available as pod-backed services. This solution offers both maximum efficiency and adherence for the toughest privacy or compliance demands. Information about each of these topics will be available in upcoming announcements. The following example drives the point home.
It requires a state-of-the-art system that can track and process these impressions while maintaining a detailed history of each profiles exposure. In this multi-part blog series, we take you behind the scenes of our system that processes billions of impressions daily.
This allows teams to sidestep much of the cost and time associated with managing hardware, platforms, and operating systems on-premises, while also gaining the flexibility to scale rapidly and efficiently. REST APIs, authentication, databases, email, and video processing all have a home on serverless platforms. The Serverless Process.
This guide will cover how to distribute workloads across multiple nodes, set up efficient clustering, and implement robust load-balancing techniques. Implementing clustering and quorum queues in RabbitMQ significantly improves load distribution and data redundancy, ensuring high availability and fault tolerance for messaging services.
The end goal, of course, is to optimize the availability of organizations’ software. Dynatrace AI increases efficiency by magnitudes and prevents alert storms. Dynatrace is widely recognized for its AI capabilities’ ability to predict and prevent issues, and automatically identify root causes, maximizing availability.
Here’s how Dynatrace can help automate up to 80% of technical tasks required to manage compliance and resilience: Understand the complexity of IT systems in real time Proactively prevent, prioritize, and efficiently manage performance and security incidents Automate manual and routine tasks to increase your productivity 1.
This leads to a more efficient and streamlined experience for users. Lastly, monitoring and maintaining system health within a virtual environment, which includes efficient troubleshooting and issue resolution, can pose a significant challenge for IT teams. We’re always looking for feedback and opportunities to improve.
RabbitMQ is designed for flexible routing and message reliability, while Kafka handles high-throughput event streaming and real-time data processing. RabbitMQ follows a message broker model with advanced routing, while Kafkas event streaming architecture uses partitioned logs for distributed processing. What is RabbitMQ?
The impetus for constructing a foundational recommendation model is based on the paradigm shift in natural language processing (NLP) to large language models (LLMs). These insights have shaped the design of our foundation model, enabling a transition from maintaining numerous small, specialized models to building a scalable, efficient system.
In addition to service-level monitoring, certain services within the OpenTelemetry demo application expose process-level metrics, such as CPU and memory consumption, number of threads, or heap size for services written in different languages. For this purpose, we’ll use the in-built failure scenarios included in the OpenTelemetry demo.
Among the spectrum of methodologies available for this task, batch processing is often considered an old guard, especially with the advent of real-time and event-based processing technologies. However, it would be a mistake to dismiss batch processing as an antiquated approach.
We’re happy to announce the General Availability of cross-environment dashboarding capabilities (having released this functionality in an Early Adopter release with Dynatrace version 1.172 back in June 2019). This gives you a boost in efficiency when managing multiple environments. Dynatrace news.
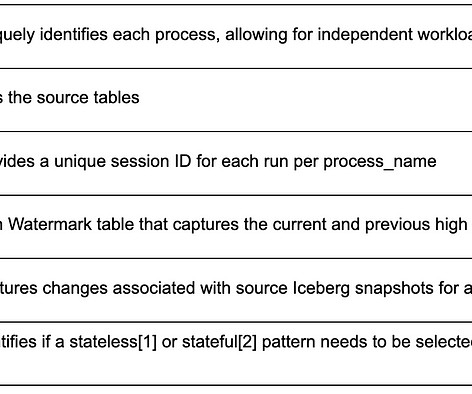
By Abhinaya Shetty , Bharath Mummadisetty In the inaugural blog post of this series, we introduced you to the state of our pipelines before Psyberg and the challenges with incremental processing that led us to create the Psyberg framework within Netflix’s Membership and Finance data engineering team.
Kickstart your creation journey using ready-made dashboards and notebooks Creating dashboards and notebooks from scratch can take time, particularly when figuring out available data and how to best use it. Kickstarting the dashboard creation process is, however, just one advantage of ready-made dashboards.
Heres what stands out: Key Takeaways Better Performance: Faster write operations and improved vacuum processes help handle high-concurrency workloads more smoothly. Incremental Backups: Speeds up recovery and makes data management more efficient for active databases. Start your free trial today!
As a result, requests are uniformly handled, and responses are processed cohesively. This data is processed from a real-time impressions stream into a Kafka queue, which our title health system regularly polls. Many of the metadata and assets involved in title setup have specific timelines for when they become available to members.
Organizations choose data-driven approaches to maximize the value of their data, achieve better business outcomes, and realize cost savings by improving their products, services, and processes. Data is then dynamically routed into pipelines for further processing. Such transformations can reduce storage costs by 99%.
Integration with existing systems and processes : Integration with existing IT infrastructure, observability solutions, and workflows often requires significant investment and customization. The certification results are now publicly available. If you’re doing one of these you’re amplifying the other.
Grafana Loki is a horizontally scalable, highly available log aggregation system. It is designed for simplicity and cost-efficiency. Logs can also be transformed appropriately for presentation, for example, or further pipeline processing. Loki can provide a comprehensive log journey.
Greenplum Database is a massively parallel processing (MPP) SQL database that is built and based on PostgreSQL. When handling large amounts of complex data, or big data, chances are that your main machine might start getting crushed by all of the data it has to process in order to produce your analytics results. Query Optimization.
Were excited to announce that Davis CoPilot Chat is now available across the Dynatrace platform. To help you navigate this and boost your efficiency, we’re excited to announce that Davis CoPilot Chat is now generally available (GA). Davis CoPilot Chat will be available with the release of Dynatrace SaaS version 1.307.
By leveraging the Dynatrace Operator and Dynatrace capabilities on Red Hat OpenShift on IBM Power, customers can accelerate their modernization to hybrid cloud and increase operational efficiencies with greater visibility across the full stack from hardware through application processes.
EdgeConnect facilitates seamless interaction, ensuring data security and operational efficiency. In this hybrid world, IT and business processes often span across a blend of on-premises and SaaS systems, making standardization and automation necessary for efficiency.
This is a set of best practices and guidelines that help you design and operate reliable, secure, efficient, cost-effective, and sustainable systems in the cloud. The framework comprises six pillars: Operational Excellence, Security, Reliability, Performance Efficiency, Cost Optimization, and Sustainability.
Enhanced data security, better data integrity, and efficient access to information. Despite initial investment costs, DBMS presents long-term savings and improved efficiency through automated processes, efficient query optimizations, and scalability, contributing to enhanced decision-making and end-user productivity.
Ideally, we would have causal estimates from an A/B test to use for validation, but since that is not available, we use another causal inference design as one of our ensemble of validation approaches. Each format has a different production process and different patterns of cash spend, called our Content Forecast.
We organize all of the trending information in your field so you don't have to. Join 5,000+ users and stay up to date on the latest articles your peers are reading.
You know about us, now we want to get to know you!
Let's personalize your content
Let's get even more personalized
We recognize your account from another site in our network, please click 'Send Email' below to continue with verifying your account and setting a password.


Let's personalize your content