This site uses cookies to improve your experience. To help us insure we adhere to various privacy regulations, please select your country/region of residence. If you do not select a country, we will assume you are from the United States. Select your Cookie Settings or view our Privacy Policy and Terms of Use.
Cookie Settings
Cookies and similar technologies are used on this website for proper function of the website, for tracking performance analytics and for marketing purposes. We and some of our third-party providers may use cookie data for various purposes. Please review the cookie settings below and choose your preference.
Used for the proper function of the website
Used for monitoring website traffic and interactions
Cookie Settings
Cookies and similar technologies are used on this website for proper function of the website, for tracking performance analytics and for marketing purposes. We and some of our third-party providers may use cookie data for various purposes. Please review the cookie settings below and choose your preference.
Strictly Necessary: Used for the proper function of the website
Performance/Analytics: Used for monitoring website traffic and interactions
As of October 2024, Dynatrace is available on Microsoft Azure Australia East region, enabling joint customers to maintain a local SaaS presence. As a SaaS vendor, Dynatrace carefully manages its deployments across different regions, assuring the efficient and optimal use of infrastructure to serve and support Dynatrace platform customers.
A good Kubernetes SLO strategy helps teams manage and make containerized workloads more efficient. Efficient coordination of resource usage, requests, and allocation is critical. As every container has defined requests for CPU and memory, these indicators are well-suited for efficiency monitoring.
These innovations promise to streamline operations, boost efficiency, and offer deeper insights for enterprises using AWS services. This year’s AWS re:Invent will showcase a suite of new AWS and Dynatrace integrations designed to enhance cloud performance, security, and automation.
However, they often come with challenges that can significantly impact the efficiency and productivity of software development teams. In this article, we will delve deeper into the issues associated with meetings in software engineering and explore the available data.
Adopting AI to enhance efficiency and boost productivity is critical in a time of exploding data, cloud complexities, and disparate technologies. The Dynatrace and Microsoft partnership provides innovative solutions that enhance customer experience, improve efficiency, and generate considerable savings.
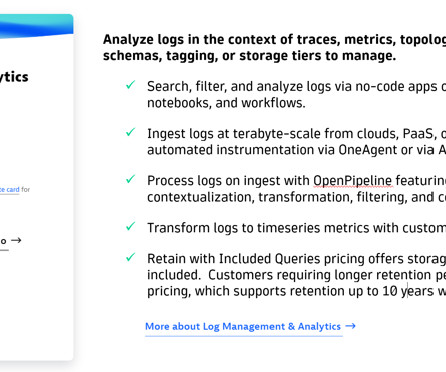
Fast and efficient log analysis is critical in todays data-driven IT environments. For enterprises managing complex systems and vast datasets using traditional log management tools, finding specific log entries quickly and efficiently can feel like searching for a needle in a haystack. What are Dynatrace Segments?
By leveraging Dynatrace observability on Red Hat OpenShift running on Linux, you can accelerate modernization to hybrid cloud and increase operational efficiencies with greater visibility across the full stack from hardware through application processes. Dynatrace observability is available for Red Hat OpenShift on IBM Power.
The application consists of several microservices that are available as pod-backed services. This solution offers both maximum efficiency and adherence for the toughest privacy or compliance demands. Information about each of these topics will be available in upcoming announcements. The following example drives the point home.
This demand for rapid innovation is propelling organizations to adopt agile methodologies and DevOps principles to deliver software more efficiently and securely. And how do DevOps monitoring tools help teams achieve DevOps efficiency? Lost efficiency. 54% reported deploying updates every two hours or less.
AV1 is one of the most efficient codecs available today. Title must be available in HDR10+format 3. Our encoding pipeline is designed with flexibility and extensibility where all these HDR formats could be derived from a single DolbyVision deliverable efficiently atscale. Member device must support AV1 & HDR10+.
Sometimes, introducing new IT solutions is delayed or canceled because a single business unit can’t manage the operating costs alone, and per-department cost insights that could facilitate cost sharing aren’t available. Costs and their origin are transparent, and teams are fully accountable for the efficient usage of cloud resources.
To ensure continuous availability, it‘s essential to proactively analyze potential problems and optimize the environment in advance to minimize the negative impact on users and improve user experience. The proper focus and best optimization level must be chosen wisely to get the most out of the available time.
Let’s assume we created a service-availability SLO, monitoring the request failure count against the overall request counts. Contact Sales The post Efficient SLO event integration powers successful AIOps appeared first on Dynatrace news. What characterizes a weak SLO? Interested in learning more? Contact us for a free demo.
Managing High Availability (HA) in your PostgreSQL hosting is very important to ensuring your database deployment clusters maintain exceptional uptime and strong operational performance so your data is always available to your application. Effective management of failover and switchover operations is crucial for high availability.
Monitor and optimize business processes with real-time visibility into process KPIs and detailed analytics for each step to improve customer satisfaction, increase operational efficiency, and reduce cost. Simplified and enhanced analytics efficiency. Reduced storage and query overhead for business use cases.
This feature, available by default for OTel-instrumented services, allows users a standard way to measure and compare response times across different services consistently. These histograms are more efficient in carrying a high dynamic range of different values and ensure that the relative error for every bucket remains stable.
Dynatrace Live Debugger makes troubleshooting efficient, seamless, and non-disruptive. Live snapshot Visual Studio Code IDE Live snapshot IntelliJ IDE Get even more context and telemetries from Dynatrace into your IDE Having real-time code-level data available within the IDE is only the beginning.
The end goal, of course, is to optimize the availability of organizations’ software. Dynatrace AI increases efficiency by magnitudes and prevents alert storms. Dynatrace is widely recognized for its AI capabilities’ ability to predict and prevent issues, and automatically identify root causes, maximizing availability.
This leads to a more efficient and streamlined experience for users. Lastly, monitoring and maintaining system health within a virtual environment, which includes efficient troubleshooting and issue resolution, can pose a significant challenge for IT teams. We’re always looking for feedback and opportunities to improve.
Both categories share common requirements, such as high throughput and high availability. Eventually Consistent Global Counter While some users may accept the limitations of a Best-Effort counter, others opt for precise counts, durability and global availability. This is where most of the complexity in Counter Abstraction comes in.
Drive efficiency and get more value out your logs with this predictable pricing model while youre building your log analytics practices. Disclaimer: This publication may include references to the planned testing, release, and/or availability of Dynatrace products and services.
In this blog post, we will see how Dynatrace harnesses the power of observability and analytics to tailor a new experience to easily extend to the left, allowing developers to solve issues faster, build more efficient software, and ultimately improve developer experience!
Activate Davis AI to analyze charts within seconds Davis AI can help you expand your dashboards and dive deeper into your available data to extract additional information. This ensures optimal resource utilization and cost efficiency. This is where Davis AI for exploratory analytics can make all the difference.
Dynatrace, available as an Azure-native service , has a longstanding partnership with Microsoft, deeply rooted in a strong “build with” approach to deliver seamless user experience. This enables Dynatrace customers to achieve faster time-to-value and accelerate innovation. Click here to read our full press release.
Note that the developers of the respective services need to make these metrics available by exposing them via, for example, a Prometheus endpoint that can be used by the OpenTelemetry collector to ingest them and forward them to your Dynatrace tenant.
This guide will cover how to distribute workloads across multiple nodes, set up efficient clustering, and implement robust load-balancing techniques. Implementing clustering and quorum queues in RabbitMQ significantly improves load distribution and data redundancy, ensuring high availability and fault tolerance for messaging services.
Kickstart your creation journey using ready-made dashboards and notebooks Creating dashboards and notebooks from scratch can take time, particularly when figuring out available data and how to best use it. This feature lets you explore any available metric and add it to Notebooks or Dashboards.
This dual-path approach leverages Kafkas capability for low-latency streaming and Icebergs efficient management of large-scale, immutable datasets, ensuring both real-time responsiveness and comprehensive historical data availability. million impression events globally every second, with each event approximately 1.2KB in size.
These insights have shaped the design of our foundation model, enabling a transition from maintaining numerous small, specialized models to building a scalable, efficient system. At inference time, when multi-step decoding is needed, we can deploy KV caching to efficiently reuse past computations and maintain lowlatency.
The Insight TriadAPI To efficiently understand the health of a title and triage issues quickly, all implementations of the observability endpoint must answer: is the title eligible for this phase of promotion, if notwhy is it not eligible, and what can be done to fix any problems. The request schema for the observability endpoint.
Kafka scales efficiently for large data workloads, while RabbitMQ provides strong message durability and precise control over message delivery. Message brokers handle validation, routing, storage, and delivery, ensuring efficient and reliable communication. This allows Kafka clusters to handle high-throughput workloads efficiently.
The certification results are now publicly available. The calculations and methodology used are in line with the best available scientific approach, as well as with relevant reporting requirements. If you’re doing one of these you’re amplifying the other.
Here’s how Dynatrace can help automate up to 80% of technical tasks required to manage compliance and resilience: Understand the complexity of IT systems in real time Proactively prevent, prioritize, and efficiently manage performance and security incidents Automate manual and routine tasks to increase your productivity 1.
Incremental Backups: Speeds up recovery and makes data management more efficient for active databases. Performance Optimizations PostgreSQL 17 significantly improves performance, query handling, and database management, making it more efficient for high-demand systems. Start your free trial today!
Whether you’re a seasoned IT expert or a marketing professional looking to improve business performance, understanding the data available to you is essential. As you went through these steps, you likely noticed some of the chart options available. Also, explore additional dashboards available on the Dynatrace Playground.
By leveraging the Dynatrace Operator and Dynatrace capabilities on Red Hat OpenShift on IBM Power, customers can accelerate their modernization to hybrid cloud and increase operational efficiencies with greater visibility across the full stack from hardware through application processes.
Were excited to announce that Davis CoPilot Chat is now available across the Dynatrace platform. To help you navigate this and boost your efficiency, we’re excited to announce that Davis CoPilot Chat is now generally available (GA). Davis CoPilot Chat will be available with the release of Dynatrace SaaS version 1.307.
Grafana Loki is a horizontally scalable, highly available log aggregation system. It is designed for simplicity and cost-efficiency. Created by Grafana Labs in 2018, Loki has rapidly emerged as a compelling alternative to traditional logging systems, particularly for cloud-native and Kubernetes environments.
In this post, well walk through some of the best MySQL GUI tools available in 2025covering both free and commercial optionsso you can find the one that fits your workflow. Whether youre a developer, database administrator, or data analyst, a good GUI can make everyday tasks faster, clearer, and less error-prone. What Makes a Good MySQL GUI?
It is an efficient way to manage application health with Kubernetes probes. This article will discuss Kubernetes probes, the different types available, and how to implement them in your Kubernetes environment. Kubernetes is an open-source container orchestration platform that helps manage and deploy applications in a cloud environment.
Many large organizations rely on MS Teams for fast and efficient communications, making its reliability critical for smooth business operations. Spica Solution’s CMDB app secured second place because it effectively addresses a significant business need.
This is a set of best practices and guidelines that help you design and operate reliable, secure, efficient, cost-effective, and sustainable systems in the cloud. The framework comprises six pillars: Operational Excellence, Security, Reliability, Performance Efficiency, Cost Optimization, and Sustainability.
EdgeConnect facilitates seamless interaction, ensuring data security and operational efficiency. In this hybrid world, IT and business processes often span across a blend of on-premises and SaaS systems, making standardization and automation necessary for efficiency.
Scale with confidence: Leverage AI for instant insights and preventive operations Using Dynatrace, Operations, SRE, and DevOps teams can scale efficiently while maintaining software quality and ensuring security and reliability.
We organize all of the trending information in your field so you don't have to. Join 5,000+ users and stay up to date on the latest articles your peers are reading.
You know about us, now we want to get to know you!
Let's personalize your content
Let's get even more personalized
We recognize your account from another site in our network, please click 'Send Email' below to continue with verifying your account and setting a password.


Let's personalize your content