This site uses cookies to improve your experience. To help us insure we adhere to various privacy regulations, please select your country/region of residence. If you do not select a country, we will assume you are from the United States. Select your Cookie Settings or view our Privacy Policy and Terms of Use.
Cookie Settings
Cookies and similar technologies are used on this website for proper function of the website, for tracking performance analytics and for marketing purposes. We and some of our third-party providers may use cookie data for various purposes. Please review the cookie settings below and choose your preference.
Used for the proper function of the website
Used for monitoring website traffic and interactions
Cookie Settings
Cookies and similar technologies are used on this website for proper function of the website, for tracking performance analytics and for marketing purposes. We and some of our third-party providers may use cookie data for various purposes. Please review the cookie settings below and choose your preference.
Strictly Necessary: Used for the proper function of the website
Performance/Analytics: Used for monitoring website traffic and interactions
Membership in MISA is nomination-only and reserved for independent software vendors who develop security solutions that effectively integrate with MISA-qualifying Microsoft Security products. That’s why we’re proud to announce that Dynatrace has joined the Microsoft Intelligent Security Association (MISA).
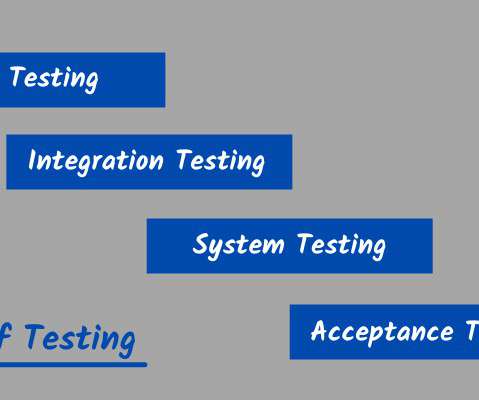
The goal of Levels of Testing is to make software testing more structured and efficient, as well as to make it easier to identify all available test cases and test scenarios at a given level. There are various steps in the SDLC paradigm, such as requirement gathering, analysis, coding, design, execution, testing, and deployment.
Dynatrace full stack observability for Red Hat OpenShift Dynatrace enhances software quality and operational efficiency, which drives innovation by unifying application, operation, and platform engineering teams on a single platform. Dynatrace is designed to scale easily across the entire Kubernetes stack.
Creating an ecosystem that facilitates data security and data privacy by design can be difficult, but it’s critical to securing information. When organizations focus on data privacy by design, they build security considerations into cloud systems upfront rather than as a bolt-on consideration.
How To Design For High-Traffic Events And Prevent Your Website From Crashing How To Design For High-Traffic Events And Prevent Your Website From Crashing Saad Khan 2025-01-07T14:00:00+00:00 2025-01-07T22:04:48+00:00 This article is sponsored by Cloudways Product launches and sales typically attract large volumes of traffic.
Every software developer has faced the frustration of debugging. Live snapshot Visual Studio Code IDE Live snapshot IntelliJ IDE Get even more context and telemetries from Dynatrace into your IDE Having real-time code-level data available within the IDE is only the beginning. Find the list of supported frameworks in our Trust Center.
Managing High Availability (HA) in your PostgreSQL hosting is very important to ensuring your database deployment clusters maintain exceptional uptime and strong operational performance so your data is always available to your application. Effective management of failover and switchover operations is crucial for high availability.
By: Rajiv Shringi , Oleksii Tkachuk , Kartik Sathyanarayanan Introduction In our previous blog post, we introduced Netflix’s TimeSeries Abstraction , a distributed service designed to store and query large volumes of temporal event data with low millisecond latencies. Today, we’re excited to present the Distributed Counter Abstraction.
Kickstart your creation journey using ready-made dashboards and notebooks Creating dashboards and notebooks from scratch can take time, particularly when figuring out available data and how to best use it. This approach acknowledges that in any organization, software works in isolation; boundaries and responsibilities are often blurred.
In this blog post, we will see how Dynatrace harnesses the power of observability and analytics to tailor a new experience to easily extend to the left, allowing developers to solve issues faster, build more efficient software, and ultimately improve developer experience!
Building services that adhere to software best practices, such as Object-Oriented Programming (OOP), the SOLID principles, and modularization, is crucial to have success at this stage. This endpoint efficiently reads from all available Hollow Feeds to obtain the current status, thanks to Hollows in-memory capabilities.
Offering comprehensive access to files, software features, and the operating system in a more user-friendly manner to ensure control. Learning Resources: Are there tutorials, guides, and comprehensive documentation available for the tool? Providing windows to streamline multitasking through programs and file structures.
To make data count and to ensure cloud computing is unabated, companies and organizations must have highly available databases. This guide provides an overview of what high availability means, the components involved, how to measure high availability, and how to achieve it. How does high availability work?
Dynatrace full stack Red Hat OpenShift observability Dynatrace unifies platform engineering and application teams on a single platform, enhancing software quality and operational efficiency to drive innovation. Scalability and cloud-native support: Dynatrace is designed to scale effortlessly in dynamic Kubernetes environments.
When it comes to access to their applications, users demand instant, reliable, and secure interactions — and that means databases must be highly available. With database high availability (HA), services are largely uninterrupted, and end users are largely satisfied. The obvious answer is this: To achieve high availability.
Cloud-native environments bring speed and agility to software development and operations (DevOps) practices. DevOps is focused on optimizing software development and delivery, and SRE is focused on operations processes. DevOps is best thought of as a practical approach to speeding up new software development and delivery.
Hardware - servers/storage hardware/software faults such as disk failure, disk full, other hardware failures, servers running out of allocated resources, server software behaving abnormally, intra DC network connectivity issues, etc. Again the approach here is the same. Monitor the servers on various parameters and build redundancy.
DevOps seeks to accomplish smooth and efficient software creation, delivery, monitoring, and improvement by prioritizing agility and adaptability over rigid, stage-by-stage development. How do organizations implement this approach to software development, and what capabilities do they need to make this shift a success? Dynatrace news.
Amazon’s new general-purpose Linux for AWS is designed to provide a secure, stable, and high-performance execution environment to develop and run cloud applications. This is done by detecting availability and performance problems in real time across an entire technology stack while presenting teams with answers — not alert storms.
Modern software intelligence needs a new approach. It should be open by design to accelerate innovation, enable powerful integration with other tools, and purposefully unify data and analytics. All innovations based on Grail are only available in Dynatrace SaaS environments. Two editing modes are available: single and bulk.
Regarding contemporary software architecture, distributed systems have been widely recognized for quite some time as the foundation for applications with high availability, scalability, and reliability goals. Spring Boot's default codes and annotation setup lessen the time it takes to design an application.
Platform engineering is a practice that outlines how development teams build internal platforms to create self-service capabilities for software engineering teams. The result is a cloud-native approach to software delivery. Centralized development practices, security protocols, and operational procedures make this consistency possible.
Monitor your cloud OpenPipeline ™ is the Dynatrace platform data-handling solution designed to seamlessly ingest and process data from any source, regardless of scale or format. Furthermore, OpenPipeline is designed to collect and process data securely and in compliance with industry standards.
At Intel we've been creating a new analyzer tool to help reduce AI costs called AI Flame Graphs : a visualization that shows an AI accelerator or GPU hardware profile along with the full software stack, based on my CPU flame graphs. It's designed to be easy and low-overhead , just like a CPU profiler. Why is AI profiling hard?
Software reliability and resiliency don’t just happen by simply moving your software to a modern stack, or by moving your workloads to the cloud. The subject line said: “Success Story: Major Issue in single AWS Frankfurt Availability Zone!” Fact #4: Multi-node, multi-availability zone deployment architecture.
According to leading analyst firm Gartner, “80% of software engineering organizations will establish platform teams as internal providers of reusable services, components, and tools for application delivery…” by 2026. Platform engineering is on the rise.
Performances testing helps establish the scalability, stability, and speed of the software application. Performance testing does not essentially display imperfections with an app, yet it needs to ensure that the app function as expected despite the bandwidth availability, network fluctuations, or traffic overload.
Synthetic testing is an IT process that uses software to discover and diagnose performance issues with user journeys by simulating real-user activity. Along with real user monitoring (RUM), synthetic testing provides a comprehensive view into the user experience to ensure software meets user requirements.
APM solutions track key software application performance metrics using monitoring software and telemetry data. Organizations use APM to ensure system availability, optimize service performance and response times, and improve user experiences. APM solutions: A primer. How to evaluate APM solutions.
In the Magic Quadrant report, Gartner defines APM as, “software that enables the observation of application behavior and its infrastructure dependencies, users, and business key performance indicators (KPIs) throughout the application’s life cycle.” The Gartner document is available upon request from Dynatrace.
Build an umbrella for Development and Operations In modern software engineering, the discipline of platform engineering delivers DevSecOps practices to developers to bridge the gaps between development, security, and operations and enhance the developer experience. Instead, it derives the suitable thresholds from previous validation results.
that the Dynatrace® Software Intelligence Platform meets the strict security and compliance standards required to enable secure and flawless digital interactions and drive digital transformation initiatives at scale. Therefore, many lack training and familiarity with newer tools designed for cloud-based technologies.
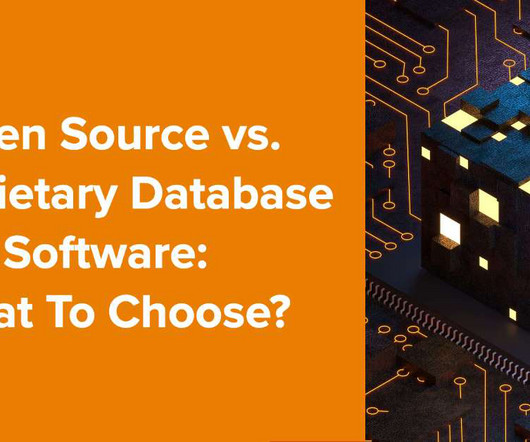
Let’s start with a simple introductory comparison: With proprietary (closed source) database software, the public does not have access to the source code; only the company that owns it and those given access can modify it. Those most involved with open source software know the reality about security. The list goes on and on.
Combining Dynatrace’s automated and intelligent observability and DevOps orchestration with JFrog’s CI/CD helps teams deliver better software faster. This improves collaboration and allows organizations to release high-quality software faster, and with more confidence.” . Dynatrace news.
Cloud providers then manage physical hardware, virtual machines, and web server software management. Monolithic architectures were commonplace with legacy, on-premises software solutions. Software as a service (SaaS) delivers on-demand applications. Increased availability. FaaS vs. monolithic architectures.
These can include business metrics, such as conversion rates, uptime, and availability; service metrics, such as application performance; or technical metrics, such as dependencies to third-party services, underlying CPU, and the cost of running a service. availability of a website over a year, your error budget is.05%. Avoid downtime.
That seemed like something worth testing outor at least playing around withso when I heard that it very quickly became available in Ollama and wasnt too large to run on a moderately well-equipped laptop, I downloaded QwQ and tried it out. Could training models specifically on design patterns be a breakthrough?
The exponential growth of data volume—including observability, security, software lifecycle, and business data—forces organizations to deal with cost increases while providing flexible, robust, and scalable ingest. Figure 2: Configuration and ingest throughput for each source, grouped by type Protect your sensitive data Privacy by design.
Instead of worrying about infrastructure management functions, such as capacity provisioning and hardware maintenance, teams can focus on application design, deployment, and delivery. The first benefit is simplicity. But which are the best fit for your business, and where do they make the most sense in your serverless application stack?
APIs are everywhere these days—from internal APIs that are used within your microservice architecture, third-party APIs that your software relies on, to external APIs that you offer to your customers. With the new page design, you can: Instantly understand the scope of problems with aggregated availability.
Stream processing One approach to such a challenging scenario is stream processing, a computing paradigm and software architectural style for data-intensive software systems that emerged to cope with requirements for near real-time processing of massive amounts of data. We designed experimental scenarios inspired by chaos engineering.
While these vulnerabilities aren’t anything new, the modular and distributed nature of modern software development introduces a new potential for application security risks. Use a safe development life cycle with secure design patterns and components. Apply threat modeling and plausibility checks.
But the distinction between senior and junior software developers is built into our jobs and job titles. As they move into the workforce, they need to deepen their knowledge and become part of a team writing a software system for a paying customer. It almost sounds pejorative, doesnt it?
In contrast, monolithic architecture structures software in a single tier. Monolithic software systems employ one large codebase, which includes collections of tools, software development kits, and associated development dependencies. Experienced developers see microservice design patterns as more platform-agnostic.
We organize all of the trending information in your field so you don't have to. Join 5,000+ users and stay up to date on the latest articles your peers are reading.
You know about us, now we want to get to know you!
Let's personalize your content
Let's get even more personalized
We recognize your account from another site in our network, please click 'Send Email' below to continue with verifying your account and setting a password.


Let's personalize your content