This site uses cookies to improve your experience. To help us insure we adhere to various privacy regulations, please select your country/region of residence. If you do not select a country, we will assume you are from the United States. Select your Cookie Settings or view our Privacy Policy and Terms of Use.
Cookie Settings
Cookies and similar technologies are used on this website for proper function of the website, for tracking performance analytics and for marketing purposes. We and some of our third-party providers may use cookie data for various purposes. Please review the cookie settings below and choose your preference.
Used for the proper function of the website
Used for monitoring website traffic and interactions
Cookie Settings
Cookies and similar technologies are used on this website for proper function of the website, for tracking performance analytics and for marketing purposes. We and some of our third-party providers may use cookie data for various purposes. Please review the cookie settings below and choose your preference.
Strictly Necessary: Used for the proper function of the website
Performance/Analytics: Used for monitoring website traffic and interactions
Log ingestion can seem daunting when getting started with Dynatrace, especially when staring at an empty screen in the Logs or Clouds apps. The Discovery & Coverage app provides Dynatrace administrators with the same OneAgent installation experience they receive with the Clouds and Logs apps.
CVE recently published three new critical vulnerabilities in the Java Spring Framework, including one called Spring4Shell. Many applications are potentially affected, as Spring dominates the Java ecosystem , with 60% of developers using it in their main Java applications. Information Exposure in Spring Cloud Function.
Establishing end-to-end observability insights for today’s highly dynamic and exceedingly complex cloud-native production environments represents an enormous challenge to IT operations and SRE teams who are responsible for ensuring that hundreds, or even thousands, of running services meet with agreed upon SLOs. Dynatrace news.
Although these COBOL applications operate with consistent performance, companies and governments are forced to transform them to new platforms and rewrite them in modern programming languages (like Java) for several reasons. Thus, implementing applications in Java can result in considerable financial savings.
Cloud-native technologies and microservice architectures have shifted technical complexity from the source code of services to the interconnections between services. Observability for heterogeneous cloud-native technologies is key. Heterogeneous cloud-native microservice architectures can lead to visibility gaps in distributed traces.
Cloud-native technologies, including Kubernetes and OpenShift, help organizations accelerate innovation. Open source has also become a fundamental building block of the entire cloud-native stack. Why cloud-native applications, Kubernetes, and open source require a radically different approach to application security.
In recent years, function-as-a-service (FaaS) platforms such as Google Cloud Functions (GCF) have gained popularity as an easy way to run code in a highly available, fault-tolerant serverless environment. What is Google Cloud Functions? GCF is part of the Google Cloud Platform. How Google Cloud Functions works.
Having released this functionality in an Early Adopter Release with OneAgent version 1.173 and Dynatrace version 1.174 back in August 2019, we’re now happy to announce the General Availability of OneAgent full-stack monitoring for Linux on the IBM Z platform, sometimes informally referred to as Z/Linux. Host-performance measures.
For IT teams seeking agility, cost savings, and a faster on-ramp to innovation, a cloud migration strategy is critical. Cloud migration enables IT teams to enlist public cloud infrastructure so an organization can innovate without getting bogged down in managing all aspects of IT infrastructure as it scales. Dynatrace news.
Cloud-native CI/CD pipelines and build processes often expose Kubernetes to attack vectors via internet-sourced container images. Compliance : Adhering to stringent security standards helps meet regulatory and compliance requirements for cloud-native environments.
Cloud-native observability is a prerequisite for companies that need to meet these expectations. This provides a holistic view, advanced analytics, and AI-powered answers for cloud optimization and troubleshooting. This seamless user journey is also available from the log viewer side. Dynatrace news. How to get started.
Cloud-native observability for Google’s fully managed GKE Autopilot clusters demands new methods of gathering metrics, traces, and logs for workloads, pods, and containers to enable better accessibility for operations teams. First, we create a small Kubernetes cluster in the Google Cloud Console. and GKE Autopilot 126.
In the final post of this series, we will review the last solution, Patroni by Zalando, and compare all three at the end so you can determine which high availability framework is best for your PostgreSQL hosting deployment. Managing High Availability in PostgreSQL – Part I: PostgreSQL Automatic Failover. Patroni for PostgreSQL.
Modern, cloud-native computing is impossible to separate from containers and Kubernetes adoption. As Kubernetes adoption increases and it continues to advance technologically, Kubernetes has emerged as the “operating system” of the cloud. Kubernetes moved to the cloud in 2022. Java, Go, and Node.js Java, Go, and Node.js
Observability should be as cloud-native as Kubernetes itself. More ActiveGate capabilities will be available as Kubernetes pods later this year. A foundation for delivering cloud-native injection using the best of both worlds: Automatic “app-only” via Kubernetes admission controllers along with OneAgent Kubernetes monitoring.
Learning Resources: Are there tutorials, guides, and comprehensive documentation available for the tool? Web-Based or Desktop: Does the tool offer both desktop and web-based versions for flexible access, particularly in remote or cloud environments? An additional cloud feature facilitating project-based team collaboration.
In this latest trends report, we analyze the most popular cloud providers for PostgreSQL, VACUUM strategies, query management strategies, and on-premises vs. public cloud use being leveraged by enterprise organizations. Most Popular Cloud Providers for PostgreSQL Hosting. of PostgreSQL cloud use compared to 55.0%
We’re happy to announce the Early Adopter Release of OneAgent full-stack monitoring for Linux on the IBM Z platform, sometimes informally referred to as Z/Linux (available with OneAgent version 1.173 and Dynatrace version 1.174). For details on available metrics, see our help page on host performance monitoring. Dynatrace news.
It removes the burden of managing underlying infrastructure and is broadly adopted for cloud-native application environments. Figure 1: This is a service flow, showing how a certain microservice depends on a specific Lambda function that fetches real-time data from a public cloud provider. Leverage the latest improvements today.
And the distinction between applications and cloud platforms is blurring. With new enhancements, Dynatrace Application Security now provides Runtime Vulnerability Analysis across the entire application stack in cloud-native environments. Dynatrace extends its Runtime Vulnerability Analysis to Go on top of Java ,NET , Node.js
Feature flags are an essential tool in the modern software delivery lifecycle for cloud-native applications. Feature flagging and feature management are critical components in the effective delivery of cloud-native applications. SDKs are lightweight, developer friendly, and flexible. What’s next?
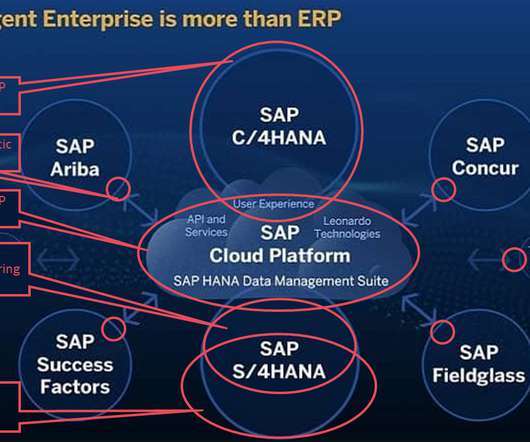
Monitoring SAP products can present challenges Monitoring SAP systems can be challenging due to the inherent complexity of using different technologies—such as ABAP, Java, and cloud offerings—and the sheer amount of generated data. This is why Dynatrace is extending its observability capabilities for SAP with PowerConnect for SAP.
We’re proud to announce the general availability of OneAgent full-stack monitoring for the AIX operating system. While cloud-native applications often grab the lion’s share of headlines in the tech world, the data-center-native applications that many modern applications rely on still play an important role in nearly every industry.
Organizations are shifting towards cloud-native stacks where existing application security approaches can’t keep up with the speed and variability of modern development processes. In cloud-native application stacks, everything is code. and Java are the most popular languages within Kubernetes environments. Next steps.
Its design prioritizes high availability and efficient data transfer with minimal overhead, making it a practical choice for handling real-time data pipelines and distributed event processing. It follows a push-based approach, ensuring messages are distributed to consumers as soon as they become available.
Are you deploying PostgreSQL in the cloud and want to understand your options for achieving high availability? In our previous blog post, Managing High Availability in PostgreSQL – Part I , we discussed the capabilities and functioning of PostgreSQL Automatic Failover (PAF) by ClusterLabs. High Availability Test Scenarios.
Compare PostgreSQL vs. Oracle functionality across available tools, capabilities and services. Not available. Not available. Not available. New Oracle versions are generally available every 2-4 years. Data encryption can be achieved with advanced security plugins like pgcrypto which are available for free.
OpenTelemetry SDKs are available for most contemporary programming languages, such as C++, Go, Java, JavaScript, and Python (see [link] for the full list). An additional piece of the puzzle is available in the log viewer which shows billing failure messages on the workload, along with links to the distributed traces.
Log auditing—and its investigative partner, log forensics—are becoming essential practices for securing cloud-native applications and infrastructure. As organizations adopt more cloud-native technologies, observability data—telemetry from applications and infrastructure, including logs, metrics, and traces—and security data are converging.
cloud service providers are now starting to add OpenTelemetry instrumentation as an out-of-the-box feature. Gain full observability in heterogeneous cloud-native environments and reduce resolution times. Beginning with Dynatrace version 1.216, trace ingest is available in a Preview release (registration required). TL;DR summary.
Spring Boot, on the other hand, is a Java framework for building cloud-native Java applications. The Dynatrace registry v2 is available starting with version 1.8.0 Auto-configuration is available for all OneAgent-monitored hosts. Deploy at scale with auto-configuration and secure communication. Here’s how it works.
With Dynatrace Infrastructure Monitoring you get a complete solution for the monitoring of cloud platforms and virtual infrastructure, along with log monitoring and AIOps. Monitor any infrastructure component and backing service that’s written in Java. Golang runtime metrics + WebServer metrics in Infrastructure Mode.
This means that you should ask the following: Does your monitoring solution work with SAP both on-premise and within cloud infrastructure ? How about SAP hosted on private and public clouds ? Do you provide support for application technologies from ABAP through Java to HANA ?
Due to the widespread adoption and rich ecosystem of available PHP libraries, all types of security vulnerabilities can be found in PHP applications. Lack of automation to keep pace with dynamic clouds and rapid software development practices. Security teams struggle with manual approaches and lack runtime insights. New to Dynatrace?
With the rise of cloud computing, it’s now more important than ever. While in classic bare-metal stacks CPU resources are made “available” through over-provisioning, in modern SaaS environments you only pay for those CPU resources that you use—no over-provisioning of resources is required. Dynatrace news.
For example, the number of threads of your process is already available in Dynatrace in most cases, so there is no need to spend the extra effort. OneAgent & cloud metrics. With insights from Dynatrace into network latency and utilization of your cloud resources, you can design your scaling mechanisms and save on costly CPU hours.
Cloud complexity and data proliferation are two of the most significant challenges that IT teams are facing today. Modern cloud complexity is becoming nearly impossible for human beings to manage without AI and automation. “ Observability is about answering questions,” said Laifenfeld. Observability is about answering.”
You can spin up a cluster on your machine using a local Kubernetes tool such as minikube , k0s , or KinD , or use a cluster running on a cloud provider service. There are two versions available: v1alpha1 : apiVersion: opentelemetry.io/v1alpha1 inject-javafor Java apps). spec.containers[*].name}'
I have been using it at my current tour through different conferences ( Devoxx , Confitura ) and meetups, ( Cloud Native , KraQA , Trojmiasto Java UG ) where I’ve promoted keptn. On Thursday, June 27 th in the evening, I was presenting at the Cloud Native Meetup in Warsaw where I showed several keptn deployment pipeline runs.
Resource consumption: Observing computational resource availability and saturation, whether deployed in cloud-native environments like Kubernetes or CPU-enabled servers. Dynatrace OneAgent® is perfectly capable of automatically injecting and tracing code-level information for many technologies, such as Java,NET, Golang, and NodeJS.
This was all a spare time project, as my day job at Netflix at that time was as a director level manager of a team working on personalization code in Java, and it wasnt my job to write the codemyself. One of the Java engineers on my teamJian Wujoined me to help figure out the API. I built two more iOS apps that worked with Netflix.
This is because logs may be generated from thousands of applications, built by different teams, and spread across a complex global landscape of cloud and on-premises environments. Further, these resources support countless Kubernetes clusters and Java-based architectures. Providing data in context: A data lakehouse differentiator.
Since December 10, days after a critical vulnerability known as Log4Shell was discovered in servers supporting the game Minecraft, millions of exploit attempts have been made of the Log4j 2 Java library, according to one team tracking the impact, with potential threat to millions more applications and devices across the globe.
Expanding the Cloud â?? Amazon SWF makes it very easy for developers to architect and implement these tasks, run them in the cloud or on premise and coordinate their flow. They run their workers either on cloud infrastructure, such as Amazon EC2 , or on-premise. All Things Distributed. The Amazon Simple Workflow Service.
We organize all of the trending information in your field so you don't have to. Join 5,000+ users and stay up to date on the latest articles your peers are reading.
You know about us, now we want to get to know you!
Let's personalize your content
Let's get even more personalized
We recognize your account from another site in our network, please click 'Send Email' below to continue with verifying your account and setting a password.


Let's personalize your content