This site uses cookies to improve your experience. To help us insure we adhere to various privacy regulations, please select your country/region of residence. If you do not select a country, we will assume you are from the United States. Select your Cookie Settings or view our Privacy Policy and Terms of Use.
Cookie Settings
Cookies and similar technologies are used on this website for proper function of the website, for tracking performance analytics and for marketing purposes. We and some of our third-party providers may use cookie data for various purposes. Please review the cookie settings below and choose your preference.
Used for the proper function of the website
Used for monitoring website traffic and interactions
Cookie Settings
Cookies and similar technologies are used on this website for proper function of the website, for tracking performance analytics and for marketing purposes. We and some of our third-party providers may use cookie data for various purposes. Please review the cookie settings below and choose your preference.
Strictly Necessary: Used for the proper function of the website
Performance/Analytics: Used for monitoring website traffic and interactions
By: Rajiv Shringi , Oleksii Tkachuk , Kartik Sathyanarayanan Introduction In our previous blog post, we introduced Netflix’s TimeSeries Abstraction , a distributed service designed to store and query large volumes of temporal event data with low millisecond latencies. Today, we’re excited to present the Distributed Counter Abstraction.
In a MySQL master-slave high availability (HA) setup, it is important to continuously monitor the health of the master and slave servers so you can detect potential issues and take corrective actions. In this blog post, we explain some basic health checks you can do on your MySQL master and slave nodes to ensure your setup is healthy.
In our previous blog posts, we discussed the capabilities and functioning of PostgreSQL Automatic Failover (PAF) by Cluster Labs and Replication Manager (repmgr) by 2ndQuadrant. Managing High Availability in PostgreSQL – Part I: PostgreSQL Automatic Failover. Managing High Availability in PostgreSQL – Part II: Replication Manager.
MySQL does not limit the number of slaves that you can connect to the master server in a replication topology. A classic solution for this problem is to deploy a binlog server – an intermediate proxy server that sits between the master and its slaves. Ripple is an open source binlog server developed by Pavel Ivanov.
Managing High Availability (HA) in your PostgreSQL hosting is very important to ensuring your database deployment clusters maintain exceptional uptime and strong operational performance so your data is always available to your application. Effective management of failover and switchover operations is crucial for high availability.
In this blog, we will focus on histograms and why to use them. Breaking down the benefits of OpenTelemetry histograms OpenTelemetry instrumentation automatically generates histograms for HTTP client and server request durations. But for now, percentile calculation and buckets are available only for explicit bucket histograms.
It also makes the process risky as production servers might be more exposed, leading to the need for real-time production data. This typically requires production server access, which, in most organizations, is difficult to arrange. Dynatrace servers never access, process, or store customer source code.
The end goal, of course, is to optimize the availability of organizations’ software. But moreover, business is the top priority; it never made sense to me to just monitor servers. And when outages do occur, Dynatrace AI-powered, automatic root-cause analysis can also help them to remediate issues as quickly as possible.
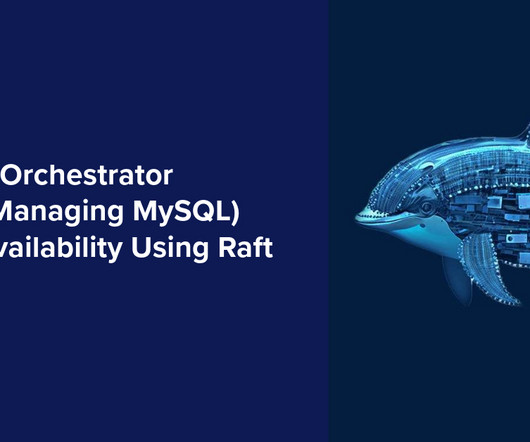
As we know,Orchestrator is a MySQL high availability and replication management tool that aids in managing farms of MySQL servers. In this blog post, we discuss how to make the Orchestrator (which manages MySQL) itself fault-tolerantand highly available.
MySQL Server generates several logs that can help you monitor the activities of the server. In this blog post, we describe some best practices for setting up and managing MySQL error logs, general logs and slow query logs for your MySQL deployments. Setting Up MySQL Server Logging.
We’re happy to announce the General Availability of cross-environment dashboarding capabilities (having released this functionality in an Early Adopter release with Dynatrace version 1.172 back in June 2019). Keep the token secret available for the second and final configuration step. Dynatrace news.
Dynatrace Managed is intrinsically highly available as it stores three copies of all events, user sessions, and metrics across its cluster nodes. Our Premium High Availability comes with the following features: Active-active deployment model for optimum hardware utilization. Dynatrace news. Minimized cross-data center network traffic.
Whether you’re a seasoned IT expert or a marketing professional looking to improve business performance, understanding the data available to you is essential. In this blog series, we’ll guide you through creating powerful dashboards that transform complex data into actionable insights. Welcome, data enthusiasts!
In this blog post, we will see how Dynatrace harnesses the power of observability and analytics to tailor a new experience to easily extend to the left, allowing developers to solve issues faster, build more efficient software, and ultimately improve developer experience!
Having released this functionality in an Early Adopter Release with OneAgent version 1.173 and Dynatrace version 1.174 back in August 2019, we’re now happy to announce the General Availability of OneAgent full-stack monitoring for Linux on the IBM Z platform, sometimes informally referred to as Z/Linux. Host-performance measures.
In a MySQL master-slave high availability (HA) setup, it is important to continuously monitor the health of the master and slave servers so you can detect potential issues and take corrective actions. In this blog post, we explain some basic health checks you can do on your MySQL master and slave nodes to ensure your setup is healthy.
OneAgent knows where to connect for further runtime configuration and where to send data because the installer itself is pre-configured to connect to the exact tenant and server that it’s downloaded from. But what if your environment grows and you decide to distribute data between two Dynatrace servers?
You can use it to visualize CPU utilization across your hosts, disk space used, server-side response time, web request/service failure rates, or any other area where you need to spot outliers immediately. To achieve the best visual outcome, we recommend experimenting with the available customization options. Try different cell shapes.
address these limitations and brings new monitoring and analytical capabilities that weren’t available to Extensions 1.0: What’s available now and what’s coming later We’ve already started to migrate Dynatrace-developed Extensions 1.0 available, and more are in the pipeline. Extensions 2.0 to the Extension Framework 2.0.
In this multi-part blog series, we take you behind the scenes of our system that processes billions of impressions daily. These events are promptly relayed from the client side to our servers, entering a centralized event processing queue. This queue ensures we are consistently capturing raw events from our global userbase.
The following components make up the OCP control plane: API server: Tracks the state of all other components and takes care of communication within and outside the cluster. Controller Manager: Runs controllers such as the node controller responsible for handling node availability.
It can scale towards a multi-petabyte level data workload without a single issue, and it allows access to a cluster of powerful servers that will work together within a single SQL interface where you can view all of the data. This feature-packed database provides powerful and rapid analytics on data that scales up to petabyte volumes.
This blog series will examine the tools, techniques, and strategies we have utilized to achieve this goal. This blog post will provide a detailed analysis of replay traffic testing, a versatile technique we have applied in the preliminary validation phase for multiple migration initiatives.
To make data count and to ensure cloud computing is unabated, companies and organizations must have highly available databases. This guide provides an overview of what high availability means, the components involved, how to measure high availability, and how to achieve it.
This blog post will share broadly-applicable techniques (beyond GraphQL) we used to perform this migration. Before GraphQL: Monolithic Falcor API implemented and maintained by the API Team Before moving to GraphQL, our API layer consisted of a monolithic server built with Falcor. To launch Phase 1 safely, we used AB Testing.
In my last blog , I’ve provided an example of this happening, whereby the traffic spiked and quadrupled the usual incoming traffic. As Dynatrace is an all in one solution, you have multiple options to capture the needed data; you can use Real User Monitoring (RUM) properties , Server-side request attribute , and Log metrics.
When it comes to access to their applications, users demand instant, reliable, and secure interactions — and that means databases must be highly available. With database high availability (HA), services are largely uninterrupted, and end users are largely satisfied. The obvious answer is this: To achieve high availability.
This blog will run through everything you need to know about the Dynatrace/PTC partnership and how Dynatrace can provide more visibility into your PTC environment. Are all your remote file serversavailable? Remote file serveravailability. Dynatrace named the recommended PTC solution.
They have made a PoC for the vulnerability available and published the relevant indicators of compromise (IoC). In this blog post, we show how to discover the original attacks toward the Aria Operations for Logs vulnerability using Dynatrace and DQL by finding the IoC-s from the log records. Spoof the IP address of the known worker.
Applications and services are often slowed down by under-performing DNS communications or misconfigured DNS servers, which can result in frustrated customers uninstalling your application. Identify under-performing DNS servers. Slower response times can be a sign of a stressed DNS server or network communication issues.
With almost 100 public locations worldwide, Dynatrace Synthetic Monitoring enables 24/7 measurement of the availability and performance of your applications as experienced by your customers and coworkers worldwide. More than 50% of the Synthetic-enabled ActiveGates used by our customers are deployed on Linux servers. What’s next.
The F5 BIG-IP Local Traffic Manager (LTM) is an application delivery controller (ADC) that ensures the availability, security, and optimal performance of network traffic flows. Business-critical applications typically rely on F5 for availability and success. It serves as a crucial component between applications and users. What’s next?
To learn more, have a look at our previous blog post, which introduced W3C Context support in Dynatrace. W3C Trace Context support is available as an Early Adopter Release (no registration required) beginning with Dynatrace version 1.180. Cross-environment tracing is available in a Preview (registration required!) Limitations.
DigitalOcean provides many advantages for database hosting, and you can learn more about them in our The Best Way to Host MongoDB on DigitalOcean blog post. Is my database cluster still highly available? DigitalOcean does not have the concept of availability zones (AZ), so we distribute the nodes across different regions.
Easily track the health and performance of database servers with AI support. To simplify database monitoring and improve cross-team collaboration, Dynatrace released new extensions to leading databases, including Oracle and Microsoft SQL Server. MS SQL Services (via WMI).
This blog post was co-written with Reese Lee. In this blog post, youll learn about the OpenTelemetry Operator (hereafter referred to as the Operator), along with issues commonly encountered across installation, Collector deployment, and auto-instrumentation. There are two versions available: v1alpha1 : apiVersion: opentelemetry.io/v1alpha1
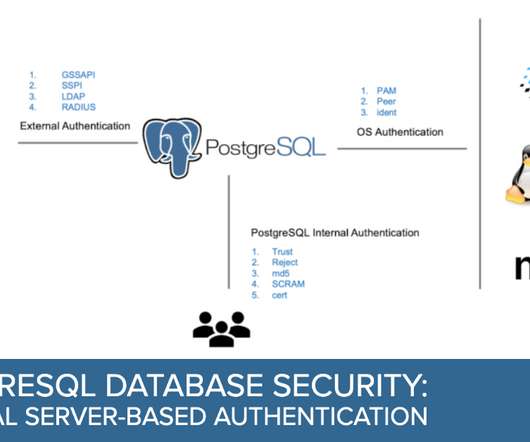
PostgreSQL server authentication refers to verifying the identity of a user trying to connect to the PostgreSQL server. The pg_hba.conf file is used to configure the authentication methods the PostgreSQL server uses and can specify different methods for different types of connections.
Puppet software can be used to automate the management and configuration of your servers, including instrumentation for Dynatrace monitoring. For full details, see our blog post Deploying thousands of OneAgents with Ansible. Why waste time on something that can be automated or scripted? Orchestrate OneAgent deployment with Puppet.
Having released this functionality in an Preview Release back in September 2019, we’re now happy to announce the General Availability of our Citrix monitoring extension. Citrix is a sophisticated, efficient, and highly scalable application delivery platform that is itself comprised of anywhere from hundreds to thousands of servers.
As the expected behavior of spot instances is that they are shut down within 5 minutes of their creation, the traditional strategy of availability alerting isn’t viable. To avoid false-positive alerts, Dynatrace availability alerting for servers automatically detects the planned downscaling of AWS spot instances.
When deploying MongoDB in production, it is strongly recommended that you use an SSL-enabled geo-distributed replica-set configuration for maximum security and availability. One option is purchasing your own CA-signed SSL certificates and configuring them on the MongoDB server. ScaleGrid provides you two options for setting up SSL.
In this post, we outline the best way to host MySQL on Azure , including managed solutions, instance types, high availability replication, backup, and disk types to use to optimize your cloud database performance. High Availability Deployment. So, how do we configure high availability for MySQL on Azure?
IT infrastructure is the heart of your digital business and connects every area – physical and virtual servers, storage, databases, networks, cloud services. This shift requires infrastructure monitoring to ensure all your components work together across applications, operating systems, storage, servers, virtualization, and more.
Dynatrace HTTP monitors help you to ensure that your APIs are available and performing well from all locations around the world in compliance with your SLAs. With the new page design, you can: Instantly understand the scope of problems with aggregated availability. Actively monitor your mobile app’s back-end service availability.
We organize all of the trending information in your field so you don't have to. Join 5,000+ users and stay up to date on the latest articles your peers are reading.
You know about us, now we want to get to know you!
Let's personalize your content
Let's get even more personalized
We recognize your account from another site in our network, please click 'Send Email' below to continue with verifying your account and setting a password.


Let's personalize your content