This site uses cookies to improve your experience. To help us insure we adhere to various privacy regulations, please select your country/region of residence. If you do not select a country, we will assume you are from the United States. Select your Cookie Settings or view our Privacy Policy and Terms of Use.
Cookie Settings
Cookies and similar technologies are used on this website for proper function of the website, for tracking performance analytics and for marketing purposes. We and some of our third-party providers may use cookie data for various purposes. Please review the cookie settings below and choose your preference.
Used for the proper function of the website
Used for monitoring website traffic and interactions
Cookie Settings
Cookies and similar technologies are used on this website for proper function of the website, for tracking performance analytics and for marketing purposes. We and some of our third-party providers may use cookie data for various purposes. Please review the cookie settings below and choose your preference.
Strictly Necessary: Used for the proper function of the website
Performance/Analytics: Used for monitoring website traffic and interactions
This guide will cover how to distribute workloads across multiple nodes, set up efficient clustering, and implement robust load-balancing techniques. Implementing clustering and quorum queues in RabbitMQ significantly improves load distribution and data redundancy, ensuring high availability and fault tolerance for messaging services.
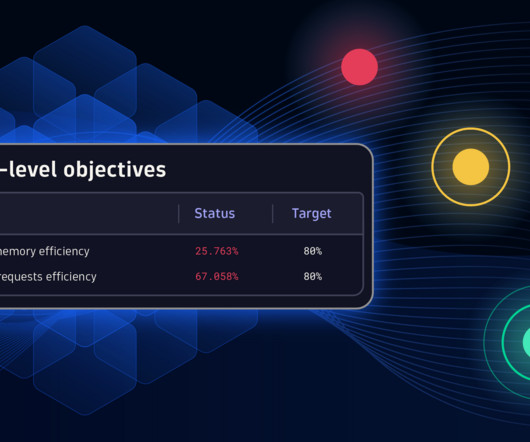
A good Kubernetes SLO strategy helps teams manage and make containerized workloads more efficient. Efficient coordination of resource usage, requests, and allocation is critical. As every container has defined requests for CPU and memory, these indicators are well-suited for efficiency monitoring.
By proactively implementing digital experience monitoring bestpractices and optimizing user experiences , organizations can increase long-term customer satisfaction and loyalty, drive business value , and accelerate innovation. This allows ITOps to measure each user journey’s effectiveness and efficiency.
These innovations promise to streamline operations, boost efficiency, and offer deeper insights for enterprises using AWS services. This year’s AWS re:Invent will showcase a suite of new AWS and Dynatrace integrations designed to enhance cloud performance, security, and automation.
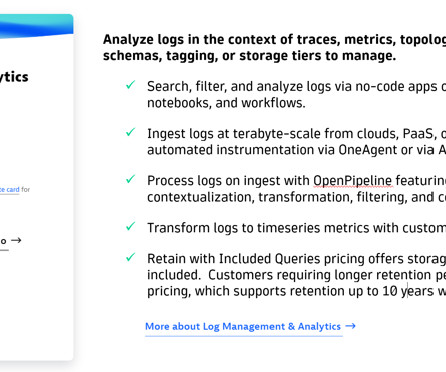
By following key log analytics and log management bestpractices, teams can get more business value from their data. Challenges driving the need for log analytics and log management bestpractices As organizations undergo digital transformation and adopt more cloud computing techniques, data volume is proliferating.
Dynatrace, available as an Azure-native service , has a longstanding partnership with Microsoft, deeply rooted in a strong “build with” approach to deliver seamless user experience. This enables Dynatrace customers to achieve faster time-to-value and accelerate innovation. Click here to read our full press release.
Adopting AI to enhance efficiency and boost productivity is critical in a time of exploding data, cloud complexities, and disparate technologies. The Dynatrace and Microsoft partnership provides innovative solutions that enhance customer experience, improve efficiency, and generate considerable savings.
Dynatrace includes a ready-made cost dashboard that provides insights into query usage and DQL bestpractices. Once you develop bestpractices and are confident with your consumption patterns, you can switch to usage-based pricing to maximize the value of your DPS investment.
Flexible pricing models that offer discounts based on commitment or availability can greatly reduce cloud waste. This includes spot instances such as unused cloud capacity that’s available at a discounted price. Dynatrace can help you achieve your FinOps strategy using observability bestpractices.
Any incident can negatively impact service availability, and even a swift reaction might not prevent financial, reputational, or societal damage from happening. Remediation activities can be triggered automatically, supporting timely and efficient incident handling. Dynatrace does not guarantee specific outcomes or savings.
Today, the composable nature of code enables skilled IT teams to create and customize automated solutions capable of improving efficiency. Here, we’ll tackle the basics, benefits, and bestpractices of IAC, as well as choosing infrastructure-as-code tools for your organization. Exploring IAC bestpractices.
Sometimes, introducing new IT solutions is delayed or canceled because a single business unit can’t manage the operating costs alone, and per-department cost insights that could facilitate cost sharing aren’t available. Costs and their origin are transparent, and teams are fully accountable for the efficient usage of cloud resources.
With the increasing frequency of cyberattacks, it is imperative to institute a set of cybersecurity bestpractices that safeguard your organization’s data and privacy. This approach helps organizations deliver more secure software and infrastructure with greater efficiency and speed. Download the free 2023 CISO Report.
Dynatrace Live Debugger makes troubleshooting efficient, seamless, and non-disruptive. Get live snapshots of remote environments and debug or validate fixes directly in your favorite IDE or in the Live Debugger web app, wherever works best. Imagine having all your observability-related data at your fingertips.
Everything is available within seconds on-demand. SOAP was bulky, and REST is a trimmed-down version but we need an even more efficient framework. As we are progressing with application development, among various things, there is one primary thing we are less worried about: computing power. We need to cut down on transportation.
Keeping ownership teams and their properties up to date is essential, as is having the right contact information available when needed. Finally, the best information is still useless if users can’t retrieve it quickly when needed and use it accordingly. Dynatrace offers several ways to ingest ownership team information.
To ensure continuous availability, it‘s essential to proactively analyze potential problems and optimize the environment in advance to minimize the negative impact on users and improve user experience. The proper focus and best optimization level must be chosen wisely to get the most out of the available time.
Fast and efficient log analysis is critical in todays data-driven IT environments. For enterprises managing complex systems and vast datasets using traditional log management tools, finding specific log entries quickly and efficiently can feel like searching for a needle in a haystack. What are Dynatrace Segments?
Embracing cloud native bestpractices to increase automation. Onboarding teams using self-service Kubernetes selectors is one of the best examples of how Dynatrace embraces cloud native technologies to increase automation, reduce bureaucracy, and encourage agility. Migration instructions are available in Dynatrace Documentation.
We’re happy to announce the General Availability of cross-environment dashboarding capabilities (having released this functionality in an Early Adopter release with Dynatrace version 1.172 back in June 2019). This gives you a boost in efficiency when managing multiple environments. Dynatrace news. Things to keep in mind.
Whether you’re a seasoned IT expert or a marketing professional looking to improve business performance, understanding the data available to you is essential. As you went through these steps, you likely noticed some of the chart options available. Also, explore additional dashboards available on the Dynatrace Playground.
Building services that adhere to software bestpractices, such as Object-Oriented Programming (OOP), the SOLID principles, and modularization, is crucial to have success at this stage. This endpoint efficiently reads from all available Hollow Feeds to obtain the current status, thanks to Hollows in-memory capabilities.
Let’s assume we created a service-availability SLO, monitoring the request failure count against the overall request counts. Error budget burn rate = Error Rate / (1 – Target) Bestpractices in SLO configuration To detect if an entity is a good candidate for strong SLO, test your SLO. What characterizes a weak SLO?
As file sizes grow and workflows become more complex, these issues are magnified, leading to inefficiencies that slow down post-production and reduce the available time spent on creativework. Depending on the market, or production budget, cutting-edge technology might not be available or affordable. So what isit?
This article strips away the complexities, walking you through bestpractices, top tools, and strategies you’ll need for a well-defended cloud infrastructure. Get ready for actionable insights that balance technical depth with practical advice.
Because of this, preserving the availability and integrity of the data stored in MySQL databases requires regular backups. By understanding the different backup strategies and types available, you can select the best approach for your organization and ensure your data is properly protected.
In my previous article about continuous integration and continuous delivery (CI/CD) , I defined CI/CD and explained how these practices work together to help DevOps teams deliver quality software faster. As automation improves quality and efficiency, the simplest result — and perhaps the most noticeable — is getting features to users faster.
With more organizations taking the multicloud plunge, monitoring cloud infrastructure is critical to ensure all components of the cloud computing stack are available, high-performing, and secure. Cloud monitoring is a set of solutions and practices used to observe, measure, analyze, and manage the health of cloud-based IT infrastructure.
A Kubernetes-centric Internal Development Platform (IDP) enables platform engineering teams to provide self-service capabilities and features to their DevSecOps teams who need resilient, available, and secure infrastructure to build and deploy business-critical customer applications. Automation, automation, automation.
Efficient coordination among resource usage, requests, and allocation is critical. By continuously evaluating CPU, memory usage, and capacity, and comparing these available resources to the requested and utilized memory by Kubernetes workloads, potential waste of resources becomes visible, revealing opportunities for countermeasures.
In the data-driven landscape of today, automation has become indispensable across industries, not just to maximize efficiency but, more importantly, to ensure quality. This holds true for the critical field of data engineering as well. This comprehensive guide takes an in-depth look at automated testing in the data engineering domain.
While the Explore interface is useful for quickly visualizing known metrics, Davis CoPilot is great for exploring your data when you know your desired outcome but are unfamiliar with the available data. exploring your data when you know your desired outcome but are unfamiliar with the available data.
Most approaches focus on improving Power Usage Effectiveness (PUE), a data center energy-efficiency measure. energy-efficient data centers—cloud providers—achieve values closer to 1.2. This computational efficiency also reduces energy consumption, which in turn reduces carbon emissions. A PUE of 1.0 Want to learn more?
This is a set of bestpractices and guidelines that help you design and operate reliable, secure, efficient, cost-effective, and sustainable systems in the cloud. The framework comprises six pillars: Operational Excellence, Security, Reliability, Performance Efficiency, Cost Optimization, and Sustainability.
Dynatrace is essential for unlocking that gold mine of data, allowing you to enhance application performance, deliver better experiences, and optimize operational efficiency. Applying Service Level Objectives (SLO) to track these indicators is a common bestpractice within site reliability engineering.
Davis AI efficiently identified the deployment change as the potential root cause for the malfunctioning of nginx. Although Dynatrace can detect configuration changes, the bestpractice is to systematically ingest a configuration change or deployment change event each time the team modifies a configuration file.
These organizations rely heavily on performance, availability, and user satisfaction to drive sales and retain customers. AvailabilityAvailability SLO quantifies the expected level of service availability over a specific time period. Availability is typically expressed in 9’s, such as 99.9%. or 99.99% of the time.
However, scaling up software development requires more tools along the software product lifecycle, which must be configured promptly and efficiently. Efficient environment configuration at scale One of software engineers’ most significant challenges is managing the numerous tools and technologies required for the software product lifecycle.
Communicating security insights efficiently across teams in your organization isn’t easy Security management is a complex and challenging task; effectively communicating security insights is even more so. Is the right data available in these critical moments? Sample dashboard Next, you want to prepare an efficient plan for remediation.
Kubernetes is an open-source orchestration engine for containerized applications that help to automate processes such as scaling, deployments, and management with greater efficiency. . Create web applications that are highly available across multiple availability zones and scales to meet your demanding consumption footprints .
We’ll answer that question and explore cloud migration benefits and bestpractices for how to go through your migration smoothly. Cloud migration is the process of transferring some or all your data, software, and operations to a cloud-based computing environment that offers unlimited scale and high availability.
From mobile applications to websites, government services must be accessible, available, and performant for those who rely on them. For example, an employee might not have the tools to efficiently retrieve data about a customer as they work to solve an issue. This could lead to frustration on both sides and create negative experiences.
To make data count and to ensure cloud computing is unabated, companies and organizations must have highly available databases. This guide provides an overview of what high availability means, the components involved, how to measure high availability, and how to achieve it. How does high availability work?
We’re excited to announce our verified HashiCorp Terraform integration is now available for Dynatrace customers. When it comes to DevOps bestpractices, practitioners need ways to automate processes and make their day-to-day tasks more efficient. Dynatrace news. What is monitoring as code?
We organize all of the trending information in your field so you don't have to. Join 5,000+ users and stay up to date on the latest articles your peers are reading.
You know about us, now we want to get to know you!
Let's personalize your content
Let's get even more personalized
We recognize your account from another site in our network, please click 'Send Email' below to continue with verifying your account and setting a password.


Let's personalize your content