This site uses cookies to improve your experience. To help us insure we adhere to various privacy regulations, please select your country/region of residence. If you do not select a country, we will assume you are from the United States. Select your Cookie Settings or view our Privacy Policy and Terms of Use.
Cookie Settings
Cookies and similar technologies are used on this website for proper function of the website, for tracking performance analytics and for marketing purposes. We and some of our third-party providers may use cookie data for various purposes. Please review the cookie settings below and choose your preference.
Used for the proper function of the website
Used for monitoring website traffic and interactions
Cookie Settings
Cookies and similar technologies are used on this website for proper function of the website, for tracking performance analytics and for marketing purposes. We and some of our third-party providers may use cookie data for various purposes. Please review the cookie settings below and choose your preference.
Strictly Necessary: Used for the proper function of the website
Performance/Analytics: Used for monitoring website traffic and interactions
API resilience is about creating systems that can recover gracefully from disruptions, such as network outages or sudden traffic spikes, ensuring they remain reliable and secure. Here's a closer look at the major milestones in API architecture. However, it often introduces new challenges in the process.
DevOps and security teams managing today’s multicloud architectures and cloud-native applications are facing an avalanche of data. This enables proactive changes such as resource autoscaling, traffic shifting, or preventative rollbacks of bad code deployment ahead of time.
We have developed a microservices architecture platform that encounters sporadic system failures when faced with heavy traffic events. System resilience stands as the key requirement for e-commerce platforms during scaling operations to keep services operational and deliver performance excellence to users.
For cloud operations teams, network performance monitoring is central in ensuring application and infrastructure performance. If the network is sluggish, an application may also be slow, frustrating users. Worse, a malicious attacker may gain access to the network, compromising sensitive application data.
Scaling RabbitMQ ensures your system can handle growing traffic and maintain high performance. Optimizing RabbitMQ performance through strategies such as keeping queues short, enabling lazy queues, and monitoring health checks is essential for maintaining system efficiency and effectively managing high traffic loads.
With the advent of cloud computing, managing networktraffic and ensuring optimal performance have become critical aspects of system architecture. Amazon Web Services (AWS), a leading cloud service provider, offers a suite of load balancers to manage networktraffic effectively for applications running on its platform.
Service meshes are becoming increasingly popular in cloud-native applications as they provide a way to manage networktraffic between microservices. It offers several features, including: Prioritized load shedding: Drops traffic that is deemed less important to ensure that the most critical traffic is served.
Motivation With the rapid growth in Netflix member base and the increasing complexity of our systems, our architecture has evolved into an asynchronous one that enables both online and offline computation. This network connection heterogeneity made choosing a single delivery model difficult.
This article outlines the key differences in architecture, performance, and use cases to help determine the best fit for your workload. RabbitMQ follows a message broker model with advanced routing, while Kafkas event streaming architecture uses partitioned logs for distributed processing. What is RabbitMQ? What is Apache Kafka?
Cloud-native technologies and microservice architectures have shifted technical complexity from the source code of services to the interconnections between services. Heterogeneous cloud-native microservice architectures can lead to visibility gaps in distributed traces. Dynatrace news.
Without having network visibility, it’s not possible to improve our reliability, security and capacity posture. Network Availability: The expected continued growth of our ecosystem makes it difficult to understand our network bottlenecks and potential limits we may be reaching. 43416 5001 52.213.180.42 43416 5001 52.213.180.42
This becomes even more challenging when the application receives heavy traffic, because a single microservice might become overwhelmed if it receives too many requests too quickly. A service mesh is a dedicated infrastructure layer built into an application that controls service-to-service communication in a microservices architecture.
These include traditional on-premises network devices and servers for infrastructure applications like databases, websites, or email. A local endpoint in a protected network or DMZ is required to capture these messages. The key to success is making data in this complex ecosystem actionable, as many types of syslog producers exist.
In the dynamic world of microservices architecture, efficient service communication is the linchpin that keeps the system running smoothly. Understanding Service Mesh A service mesh is essentially the invisible backbone of a network, connecting and empowering the various components of a microservices ecosystem.
The system could work efficiently with a specific number of concurrent users; however, it may get dysfunctional with extra loads during peak traffic. It is almost a part of the wider performance engineering portrait, concentrating on performance glitches in the architecture and design of any software.
As organizations plan, migrate, transform, and operate their workloads on AWS, it’s vital that they follow a consistent approach to evaluating both the on-premises architecture and the upcoming design for cloud-based architecture. Fully conceptualizing capacity requirements. How to get started.
They can also develop proactive security measures capable of stopping threats before they breach network defenses. For example, an organization might use security analytics tools to monitor user behavior and networktraffic. Security analytics must also contend with the multicomponent architecture of modern IT infrastructure.
Continuous cloud monitoring with automation provides clear visibility into the performance and availability of websites, files, applications, servers, and network resources. Website monitoring examines a cloud-hosted website’s processes, traffic, availability, and resource use. So, how does cloud monitoring work?
How viewers are able to watch their favorite show on Netflix while the infrastructure self-recovers from a system failure By Manuel Correa , Arthur Gonigberg , and Daniel West Getting stuck in traffic is one of the most frustrating experiences for drivers around the world. Logs and background requests are examples of this type of traffic.
Example 1: Architecture boundaries. First, they took a big step back and looked at their end-to-end architecture (Figure 2). SLO dashboard defined by architectural boundary. This represents the total number of requests across the network. This refers to the load on your network and servers. So, what did they do?
In many ways, the shift to cloud computing and the adoption of cloud-native architectures have enabled organizations to realize greater resiliency alongside scalability. Software performance can be compromised in many ways, including software bugs, cyberattacks, overwhelming demand, backup failures, network issues, and human error.
For retail organizations, peak traffic can be a mixed blessing. While high-volume traffic often boosts sales, it can also compromise uptimes. Instead, to speed up response times, applications are now processing most data at the network’s perimeter, closest to the data’s origin.
With Dynatrace OneAgent you also benefit from support for traffic routing and traffic control. OneAgent implements network zones to create traffic routing rules and limit cross-data-center traffic. Enrich OpenTelemetry instrumentation with high-fidelity data provided by OneAgent.
Microservices-based architectures and software containers enable organizations to deploy and modify applications with unprecedented speed. The growing amount of data processed at the network edge, where failures are more difficult to prevent, magnifies complexity. However, cloud complexity has made software delivery challenging.
The original assumptions and architectural choices were no longer viable. Overview The figure below depicts a simplified high-level architecture of a single Titus cluster (a.k.a With traffic growth, a single leader node handling all request volume started becoming overloaded.
In case of a spike in traffic, you can automatically spin up more resources, often in a matter of seconds. Likewise, you can scale down when your application experiences decreased traffic. For example, as traffic increases, costs will too. This can dramatically decrease network latency and its effect on the end-user experience.
Reducing performance and architectural issues in their backend system gave them a 99% performance improvement! Singapore event last week, one of my colleagues showed a Dynatrace Service Flow for one of our customers, which consisted of 44 different layers of architecture that a single request had to travel through.
We tried a few iterations of what this new service should look like, and eventually settled on a modern architecture that aimed to give more control of the API experience to the client teams. For us, it means that we now need to have ~15 MDN tabs open when writing routes :) Let’s briefly discuss the architecture of this microservice.
Azure Virtual Network Gateways. Azure Traffic Manager. Our customers have frequently requested support for this first new batch of services, which cover databases, big data, networks, and computing. Azure DB for PostgreSQL. Azure SQL Managed Instance. Azure HDInsight. Azure Front Door.
The process involves monitoring various components of the software delivery pipeline, including applications, infrastructure, networks, and databases. Infrastructure monitoring Infrastructure monitoring reviews servers, storage, network connections, virtual machines, and other data center elements that support applications.
At Dynatrace, where we provide a software intelligence platform for hybrid environments (from infrastructure to cloud) we see a growing need to measure how mainframe architecture and the services running on it contribute to the overall performance and availability of applications. Network metrics are also collected for detected processes.
System Setup Architecture The following diagram summarizes the architecture description: Figure 1: Event-sourcing architecture of the Device Management Platform. When a new hardware device is connected, the Local Registry detects and collects a set of information about it, such as networking information and ESN.
We anticipate massive growth in the popularity of this architecture in the coming quarters, driven additionally by companies’ push for cost reductions. We’re therefore happy to announce the Early Adopter release of OneAgent full-stack monitoring for Linux on the ARM 64-bit AArch64 architecture with OneAgent version 1.191.
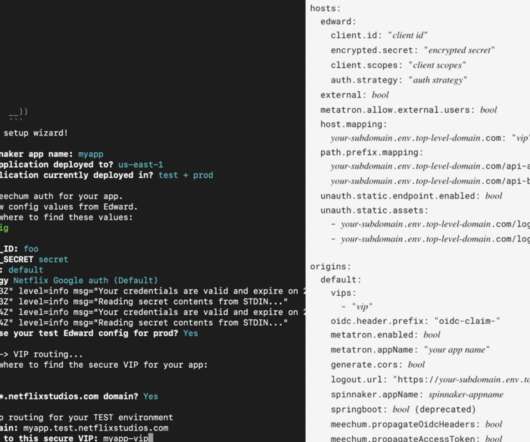
Supporting developers through those checklists for edge cases, and then validating that each team’s choices resulted in an architecture with all the desired security properties, was similarly not scalable for our security engineers. For development teams, just working through the flowcharts of requirements and options was a monumental task.
One key requirement of a microservices architecture is the ability to make information of all kinds available wherever and whenever it’s needed, without putting undue traffic on corporate and public networks.
The Dynatrace team gathered cloud billing data, infrastructure data, networking data, and analyzed that data in Dynatrace Notebooks. As a result, the team found that cloud architecture had resulted in overprovisioning of resources. “There are way over 30 availability zones.
I’ve been speaking to customers over the last few months about our new cloud architecture for Synthetic testing locations and their confusion is clear. When we wanted to add a location, we had to ship hardware and get someone to install that hardware in a rack with power and network. Sound easy? Try doing that in India.
But in today’s fast-changing technology world driven by IoT, microservice based architectures, mobile app integration, automation, and containerization, modern businesses are faced with API security issues more than ever. They are, of course, not a complete solution, as they can be intercepted like any other networktraffic.
They were focused on getting Netflix onto TV sets, and thought the screen was too small, the time people would spend watching was too short, and there wasnt enough mobile network bandwidth. We simply didnt have enough capacity in our datacenter to run the traffic, so it had to work.
Log auditing is a cybersecurity practice that involves examining logs generated by various applications, computer systems, and network devices to identify and analyze security-related events. It requires an understanding of cloud architecture and distributed systems, with the goal of automating processes.
In such circumstances, it’s challenging to investigate the reasons for unexpected behavior or traffic between pods. Now you can: Understand the actual architecture of your applications in Kubernetes in real-time. Understand the architecture of your applications in Kubernetes in real-time.
In previous blog posts, we introduced the Key-Value Data Abstraction Layer and the Data Gateway Platform , both of which are integral to Netflix’s data architecture. Handling Bursty Traffic : Managing significant traffic spikes during high-demand events, such as new content launches or regional failovers.
At Dynatrace, where we provide a software intelligence platform for hybrid environments (from infrastructure to cloud) we see a growing need to measure how mainframe architecture and the services running on it contribute to the overall performance and availability of applications. Network metrics are also collected for detected processes.
In this post, we dive deep into how Netflix’s KV abstraction works, the architectural principles guiding its design, the challenges we faced in scaling diverse use cases, and the technical innovations that have allowed us to achieve the performance and reliability required by Netflix’s global operations.
We organize all of the trending information in your field so you don't have to. Join 5,000+ users and stay up to date on the latest articles your peers are reading.
You know about us, now we want to get to know you!
Let's personalize your content
Let's get even more personalized
We recognize your account from another site in our network, please click 'Send Email' below to continue with verifying your account and setting a password.


Let's personalize your content