This site uses cookies to improve your experience. To help us insure we adhere to various privacy regulations, please select your country/region of residence. If you do not select a country, we will assume you are from the United States. Select your Cookie Settings or view our Privacy Policy and Terms of Use.
Cookie Settings
Cookies and similar technologies are used on this website for proper function of the website, for tracking performance analytics and for marketing purposes. We and some of our third-party providers may use cookie data for various purposes. Please review the cookie settings below and choose your preference.
Used for the proper function of the website
Used for monitoring website traffic and interactions
Cookie Settings
Cookies and similar technologies are used on this website for proper function of the website, for tracking performance analytics and for marketing purposes. We and some of our third-party providers may use cookie data for various purposes. Please review the cookie settings below and choose your preference.
Strictly Necessary: Used for the proper function of the website
Performance/Analytics: Used for monitoring website traffic and interactions
Dynatrace has recently enhanced its Metrics APIs, allowing everyone to send any type of metric with any set of data dimension to Davis, Dynatrace’s AI engine. In our conversation, I mentioned the new Dynatrace Metrics ingestion and off we went. ?? There are many use cases for using this API.
DevOps and security teams managing today’s multicloud architectures and cloud-native applications are facing an avalanche of data. However, the drive to innovate faster and transition to cloud-native application architectures generates more than just complexity — it’s creating significant new risk.
As dynamic systems architectures increase in complexity and scale, IT teams face mounting pressure to track and respond to conditions and issues across their multi-cloud environments. An advanced observability solution can also be used to automate more processes, increasing efficiency and innovation among Ops and Apps teams.
At the time when I was building the most innovative observability company, security seemed too distant. I realized that our platforms unique ability to contextualize security events, metrics, logs, traces, and user behavior could revolutionize the security domain by converging observability and security.
When it comes to observing Kubernetes environments, your approach must be rooted in metrics, logs, and traces —and also the context in which things happen and their impact on users. To watch the full session and learn more about how Dynatrace is accelerating innovation with Kubernetes, follow one of the local links below.
Without observability, the benefits of ARM are lost Over the last decade and a half, a new wave of computer architecture has overtaken the world. ARM architecture, based on a processor type optimized for cloud and hyperscale computing, has become the most prevalent on the planet, with billions of ARM devices currently in use.
Software should forward innovation and drive better business outcomes. Conversely, an open platform can promote interoperability and innovation. Legacy technologies involve dependencies, customization, and governance that hamper innovation and create inertia. Data supports this need for organizations to flex and modernize.
The short answer: The three pillars of observability—logs, metrics, and traces—converging on a data lakehouse. You’re getting all the architectural benefits of Grail—the petabytes, the cardinality—with this implementation,” including the three pillars of observability: logs, metrics, and traces in context.
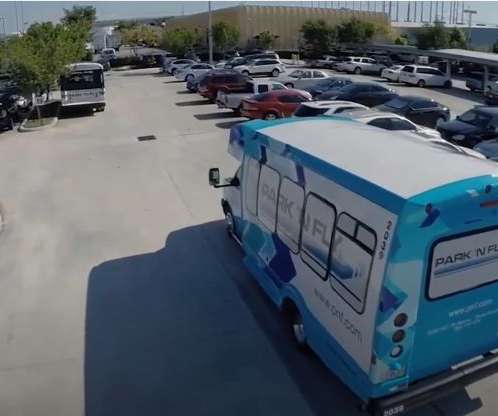
Several team members had to pore through logs, metrics, and other data to identify issues. “We Ultimately, better infrastructure management enables organizations like Park ‘N Fly to innovate through software. To do so, organizations often succumb to a “hamster wheel” of having to release code more quickly to innovate effectively.
To keep pace with the need for innovation and increasing demand, developers need to divvy up resources into “microservices” based on requirements and distribute applications accordingly — as opposed to maintaining a monolithic codebase and resource pool. Understanding monolithic architectures. Dynatrace news.
To keep pace with the need for innovation and increasing demand, developers need to divvy up resources into “microservices” based on requirements and distribute applications accordingly — as opposed to maintaining a monolithic codebase and resource pool. Understanding monolithic architectures. Dynatrace news.
Loosely defined, observability is the ability to understand what’s happening inside a system from the knowledge of the external data it produces, which are usually logs, metrics, and traces. OpenTelemetry reference architecture. Logs, metrics, and traces make up the bulk of all telemetry data. What is telemetry data?
This traditional approach presents key performance metrics in an isolated and static way, providing little or no insight into the business impact or progress toward the goals systems support. Often, these metrics are unable to even identify trends from past to present, never mind helping teams to predict future trends.
Motivation With the rapid growth in Netflix member base and the increasing complexity of our systems, our architecture has evolved into an asynchronous one that enables both online and offline computation. Architecture As shown in the diagram above, the RENO service can be broken down into the following components.
While an SLI is just a metric, an SLO just a threshold you expect your SLI to be in and SLA is just the business contract on top of an SLO. Thanks to its event-driven architecture, Keptn can pull SLIs (=metrics) from different data sources and validate them against the SLOs. Together we can drive even more innovation.
The IDC FutureScape: Worldwide IT Industry 2020 Predictions highlights key trends for IT industry-wide technology adoption for the next five years and includes these predictions: Hasten to innovation. By 2024, over 50% of all IT spending will be directly put towards digital transformation and innovation (up from 31% in 2018).
We’re delighted to share that IBM and Dynatrace have joined forces to bring the Dynatrace Operator, along with the comprehensive capabilities of the Dynatrace platform, to Red Hat OpenShift on the IBM Power architecture (ppc64le). Captures metrics, traces, logs, and other telemetry data in context.
As legacy monolithic applications give way to more nimble and portable services, the tools once used to monitor their performance are unable to serve the complex cloud-native architectures that now host them. Metrics: Numeric representation of data measured over a set period. Where traditional methods struggle.
As we did with IBM Power , we’re delighted to share that IBM and Dynatrace have joined forces to bring the Dynatrace Operator, along with the comprehensive capabilities of the Dynatrace platform, to Red Hat OpenShift on the IBM Z and LinuxONE architecture (s390x).
Also, these modern, cloud-native architectures produce an immense volume, velocity, and variety of data. Every service and component exposes observability data (metrics, logs, and traces) that contains crucial information to drive digital businesses. Manual troubleshooting is painful, hurts the business, and slows down innovation.
As part of the Cloud – Native Container Services report, ISG designed the Cloud-Native Observability Quadrant to help organizations select the best observability solution for cloud-native environments that use Kubernetes, service mesh, microservices, and serverless architectures.
Introducing Pitometer: Metrics-based Deployment Validation in your CI/CD. The following shows how to evaluate a deployment score based on metrics from Prometheus and Dynatrace. If you want to automate deployment validation based on metrics or data from tools that you already use in your CI/CD pipeline give Pitometer a try.
As legacy monolithic applications give way to more nimble and portable services, the tools once used to monitor their performance are unable to serve the complex cloud-native architectures that now host them. Metrics: Numeric representation of data measured over a set period. Where traditional methods struggle.
Today, businesses are racing ever faster to accommodate customer demands and innovate without sacrificing product quality or security. As they increase the speed of product innovation and software development, organizations have an increasing number of applications, microservices and cloud infrastructure to manage.
They now use modern observability to monitor expanding cloud environments in order to operate more efficiently, innovate faster and more securely, and to deliver consistently better business results. DevOps metrics and digital experience data are critical to this. That’s where a data lakehouse can help. Learn more.
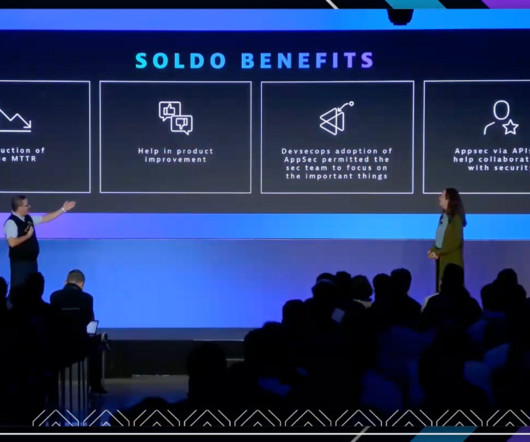
In a recent conversation at Dynatrace Innovate in Barcelona, Spain, with Liisa Tallinn, product manager of application security at Dynatrace, Domenella explained how it works. We also use Dynatrace to create the priorities for this migration because of the time it takes to fix the vulnerabilities in the old architecture.”
ABlaze: The standard view of analyses in the XP UI Suppose you’re running a new video encoding test and theorize that the two new encodes should reduce play delay, a metric describing how long it takes for a video to play after you press the start button. Getting Data with the Metrics Repo 2. Not at Netflix.
With its improved GCP capabilities, Dynatrace helps you move workloads to the cloud, build great applications, and drive innovation in hybrid and multi-cloud environments. The installation process and architecture are well documented and described in the GitHub repository. Google Cloud Datastore. Google Cloud Load Balancing.
But the cloud is forcing a rethink of tooling, platforms, technologies, and services to power new, agile, applications and application components, that break down silos, and use AI and automation to accelerate innovation. And for observability to be successful, it requires much more than just logs, metrics, and traces.
Log management and analytics is an essential part of any organization’s infrastructure, and it’s no secret the industry has suffered from a shortage of innovation for several years. Modern IT environments — whether multicloud, on-premises, or hybrid-cloud architectures — generate exponentially increasing data volumes.
Lambda serverless functions help developers innovate faster, scale easier, and reduce operational overhead, removing the burden of managing underlying infrastructure when updating and deploying code. The latest Amazon Lambda innovation, Lambda SnapStart, has day one support from Dynatrace. Understand and optimize your architecture.
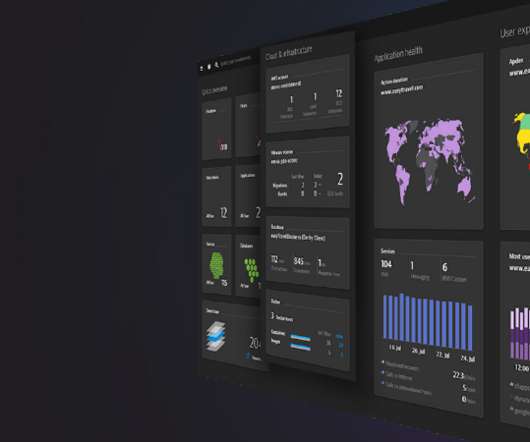
These next-generation cloud monitoring tools present reports — including metrics, performance, and incident detection — visually via dashboards. This type of monitoring tracks metrics and insights on server CPU, memory, and network health, as well as hosts, containers, and serverless functions. Cloud monitoring types and how they work.
Today’s digital businesses run on heterogeneous and highly dynamic architectures with interconnected applications and microservices deployed via Kubernetes and other cloud-native platforms. Common questions include: Where do bottlenecks occur in our architecture? Dynatrace news. How can we optimize for performance and scalability?
A single pane of glass to view trace information along with AWS CloudWatch metrics. Serverless can accelerate innovation (and introduce blind spots). Serverless architectures help developers innovate more efficiently and effectively by removing the burden of managing underlying infrastructure. the metrics you’ll?find
In many ways, the shift to cloud computing and the adoption of cloud-native architectures have enabled organizations to realize greater resiliency alongside scalability. Powered by AI and automation, Dynatrace observability and security enable teams throughout an enterprise to eliminate silos, make better decisions, and innovate faster.
As companies strive to innovate and deliver faster, modern software architecture is evolving at near the speed of light. Following the innovation of microservices, serverless computing is the next step in the evolution of how applications are built in the cloud. Understand and optimize your architecture. Dynatrace news.
Retrieval-augmented generation emerges as the standard architecture for LLM-based applications Given that LLMs can generate factually incorrect or nonsensical responses, retrieval-augmented generation (RAG) has emerged as an industry standard for building GenAI applications.
As organizations plan, migrate, transform, and operate their workloads on AWS, it’s vital that they follow a consistent approach to evaluating both the on-premises architecture and the upcoming design for cloud-based architecture. Automatic collection of the entire set of services that publish metrics to Amazon CloudWatch.
AI is driving big innovation in IT operations, with an ever-increasing demand to detect anomalies faster, sooner, and more accurately. Increasingly, organizations are turning to observability solutions to get visibility into their dynamic container-based architectures and hybrid-cloud environments. Dynatrace news.
Within the pre-packaged starter set for Windchill, all background queue metrics familiar to PTC administrators are automatically included. With Dynatrace OneAgent , gathering Windchill metrics is done in just a few clicks. With all this data, OneAgent provides instant answers with precise causation for dynamic architectures.
Davis AI contextually aligns all relevant data points—such as logs, traces, and metrics—enabling teams to act quickly and accurately while still providing power users with the flexibility and depth they desire and need. The Clouds app provides a view of all available cloud-native services.
A full-featured deterministic AIOps solution should lead to faster, higher-quality innovation, increased IT staff efficiency, and vastly improved business outcomes. When all these areas are as automated as possible, developers and operations teams can focus on innovation rather than performing endless administrative tasks.
Between multicloud environments, container-based architecture, and on-premises infrastructure running everything from the latest open-source technologies to legacy software, achieving situational awareness of your IT environment is getting harder to achieve. The challenge? Stage 2: Service monitoring. Stage 3: Diagnostics.
As more organizations transition to distributed services, IT teams are experiencing the limitations of traditional monitoring tools, which were designed for yesterday’s monolithic architectures. Where traditional monitoring falls flat. These outcomes can damage an organization’s reputation and its bottom line.
We organize all of the trending information in your field so you don't have to. Join 5,000+ users and stay up to date on the latest articles your peers are reading.
You know about us, now we want to get to know you!
Let's personalize your content
Let's get even more personalized
We recognize your account from another site in our network, please click 'Send Email' below to continue with verifying your account and setting a password.


Let's personalize your content