This site uses cookies to improve your experience. To help us insure we adhere to various privacy regulations, please select your country/region of residence. If you do not select a country, we will assume you are from the United States. Select your Cookie Settings or view our Privacy Policy and Terms of Use.
Cookie Settings
Cookies and similar technologies are used on this website for proper function of the website, for tracking performance analytics and for marketing purposes. We and some of our third-party providers may use cookie data for various purposes. Please review the cookie settings below and choose your preference.
Used for the proper function of the website
Used for monitoring website traffic and interactions
Cookie Settings
Cookies and similar technologies are used on this website for proper function of the website, for tracking performance analytics and for marketing purposes. We and some of our third-party providers may use cookie data for various purposes. Please review the cookie settings below and choose your preference.
Strictly Necessary: Used for the proper function of the website
Performance/Analytics: Used for monitoring website traffic and interactions
DevOps and security teams managing today’s multicloud architectures and cloud-native applications are facing an avalanche of data. On average, organizations use 10 different tools to monitor applications, infrastructure, and user experiences across these environments.
The scalability, agility, and continuous delivery offered by microservices architecture make it a popular option for businesses today. Nevertheless, microservices architectures are not invulnerable to disruptions.
More than 90% of enterprises now rely on a hybrid cloud infrastructure to deliver innovative digital services and capture new markets. That’s because cloud platforms offer flexibility and extensibility for an organization’s existing infrastructure. What is hybrid cloud architecture?
Infrastructure monitoring is the process of collecting critical data about your IT environment, including information about availability, performance and resource efficiency. Many organizations respond by adding a proliferation of infrastructure monitoring tools, which in many cases, just adds to the noise. Dynatrace news.
What is site reliability engineering? Site reliability engineering (SRE) is the practice of applying software engineering principles to operations and infrastructure processes to help organizations create highly reliable and scalable software systems. Dynatrace news. SRE focuses on automation.
As organizations look to expand DevOps maturity, improve operational efficiency, and increase developer velocity, they are embracing platform engineering as a key driver. The goal is to abstract away the underlying infrastructure’s complexities while providing a streamlined and standardized environment for development teams.
As cloud-native, distributed architectures proliferate, the need for DevOps technologies and DevOps platform engineers has increased as well. DevOps engineer tools can help ease the pressure as environment complexity grows. ” What does a DevOps platform engineer do? .” Amazon Web Services (AWS).
Five-nines availability has long been the goal of site reliability engineers (SREs) to provide system availability that is “always on.” Site reliability engineering teams often measure system availability in percentages in the pursuit of 100% uptime. What is always-on infrastructure?
Key takeaways from this article on modern observability for serverless architecture: As digital transformation accelerates, organizations need to innovate faster and continually deliver value to customers. Companies often turn to serverless architecture to accelerate modernization efforts while simplifying IT management.
Many organizations are taking a microservices approach to IT architecture. However, in some cases, an organization may be better suited to another architecture approach. Therefore, it’s critical to weigh the advantages of microservices against its potential issues, other architecture approaches, and your unique business needs.
Sure, cloud infrastructure requires comprehensive performance visibility, as Dynatrace provides , but the services that leverage cloud infrastructures also require close attention. Cloud-based application architectures commonly leverage microservices. Extend infrastructure observability to WSO2 API Manager.
Site reliability engineering (SRE) is the practice of applying software engineering principles to operations and infrastructure processes to help organizations create highly reliable and scalable software systems. Dynatrace news. SRE focuses on automation. SRE drives a “shift left” mindset.
When it comes to platform engineering, not only does observability play a vital role in the success of organizations’ transformation journeys—it’s key to successful platform engineering initiatives. The various presenters in this session aligned platform engineering use cases with the software development lifecycle.
By Alex Hutter , Falguni Jhaveri and Senthil Sayeebaba Over the past few years Content Engineering at Netflix has been transitioning many of its services to use a federated GraphQL platform. In a federated graph architecture, how can we answer such a query given that each entity is served by its own service?
Building and Scaling Data Lineage at Netflix to Improve Data Infrastructure Reliability, and Efficiency By: Di Lin , Girish Lingappa , Jitender Aswani Imagine yourself in the role of a data-inspired decision maker staring at a metric on a dashboard about to make a critical business decision but pausing to ask a question?—?“Can
Stream processing One approach to such a challenging scenario is stream processing, a computing paradigm and software architectural style for data-intensive software systems that emerged to cope with requirements for near real-time processing of massive amounts of data. We designed experimental scenarios inspired by chaos engineering.
Five of the most common include cluster instability, resource and cost management, security, observability, and stress on engineering teams. Engineering teams are overwhelmed with stuff to do.” The post Enhancing Kubernetes cluster management key to platform engineering success appeared first on Dynatrace news.
Architects, DevOps, and cloud engineers are gradually trying to understand which is better to continue the journey with: the API gateway, or adopt an entirely new service mesh technology?
Netflix’s engineering culture is predicated on Freedom & Responsibility, the idea that everyone (and every team) at Netflix is entrusted with a core responsibility and they are free to operate with freedom to satisfy their mission. All these micro-services are currently operated in AWS cloud infrastructure.
Arm architecture. Today, Google announced virtual machines (VMs) based on the Arm architecture on Compute Engine called Tau T2A , which are optimized for cost-effective performance for scale-out workloads, as well as GKE Arm. Meet Davis, our powerful AI-engine | Dynatrace. For some, that means looking to the?
Editor's Note: The following is an article written for and published in DZone's 2024 Trend Report, The Modern DevOps Lifecycle: Shifting CI/CD and Application Architectures. Forbes estimates that cloud budgets will break all previous records as businesses will spend over $1 trillion on cloud computing infrastructure in 2024.
Challenges The cloud network infrastructure that Netflix utilizes today consists of AWS services such as VPC, DirectConnect, VPC Peering, Transit Gateways, NAT Gateways, etc and Netflix owned devices. These metrics are visualized using Lumen , a self-service dashboarding infrastructure. What is BPF?
We’re delighted to share that IBM and Dynatrace have joined forces to bring the Dynatrace Operator, along with the comprehensive capabilities of the Dynatrace platform, to Red Hat OpenShift on the IBM Power architecture (ppc64le). Captures metrics, traces, logs, and other telemetry data in context.
As we did with IBM Power , we’re delighted to share that IBM and Dynatrace have joined forces to bring the Dynatrace Operator, along with the comprehensive capabilities of the Dynatrace platform, to Red Hat OpenShift on the IBM Z and LinuxONE architecture (s390x). Learn more about the new Kubernetes Experience for Platform Engineering.
As a platform engineer of many years now, Kubernetes has become one of those ubiquitous tools that are simply a must-have in many of our clients’ tech stacks. Platform engineers also need to test their Kubernetes infrastructure and manifests and often resort to using dedicated cloud environments to do so, which can be quite expensive.
To get a better understanding of AWS serverless, we’ll first explore the basics of serverless architectures, review AWS serverless offerings, and explore common use cases. Serverless architecture: A primer. Serverless architecture shifts application hosting functions away from local servers onto those managed by providers.
In this blog post, we explain what Greenplum is, and break down the Greenplum architecture, advantages, major use cases, and how to get started. It’s architecture was specially designed to manage large-scale data warehouses and business intelligence workloads by giving you the ability to spread your data out across a multitude of servers.
Navigate digital infrastructure complexity In today’s rapidly evolving digital environment, organizations face increasing pressure from customers and competitors to deliver faster, more secure innovations. Use case: Digital infrastructure change The problem is not always in the application.
Every day around the world, millions of trips take place across the Uber network, giving users more reliable transportation through ridesharing, bikes, and scooters, drivers and truckers additional opportunities to earn, employees and employers more convenient business travel, and hungry … The post Uber Infrastructure in 2019: Improving Reliability, (..)
For IT infrastructure managers and site reliability engineers, or SREs , logs provide a treasure trove of data. These traditional approaches to log monitoring and log analytics thwart IT teams’ goal to address infrastructure performance problems, security threats, and user experience issues.
Our Journey so Far Over the past year, we’ve implemented the core infrastructure pieces necessary for a federated GraphQL architecture as described in our previous post: Studio Edge Architecture The first Domain Graph Service (DGS) on the platform was the former GraphQL monolith that we discussed in our first post (Studio API).
OpenTelemetry provides a common set of tools, APIs, and SDKs to help collect observability signals from applications and infrastructure endpoints. OpenTelemetry Astronomy Shop demo application architecture diagram. You can also use it to test different OpenTelemetry features and evaluate how they appear on backends.
With more automated approaches to log monitoring and log analysis, however, organizations can gain visibility into their applications and infrastructure efficiently and with greater precision—even as cloud environments grow. Logs are automatically produced and time-stamped documentation of events relevant to cloud architectures.
Grail architectural basics. The aforementioned principles have, of course, a major impact on the overall architecture. A data lakehouse addresses these limitations and introduces an entirely new architectural design. It’s based on cloud-native architecture and built for the cloud. But what does that mean?
Serverless architecture makes it possible to host code anywhere, rather than relying on an origin server. No infrastructure to maintain. Because cloud providers own and manage back-end infrastructure, local IT teams aren’t responsible for ongoing maintenance and upgrades. Architectural complexity. Reduced latency.
AIOps and observability—or artificial intelligence as applied to IT operations tasks, such as cloud monitoring—work together to automatically identify and respond to issues with cloud-native applications and infrastructure. The framework forms the basis of the SAE (Society of Automotive Engineers) automation levels 1 through 5 for cars.
By deploying applications as many separate microservices managed by Kubernetes, these environments can become complicated, especially if the organization has a multi-cloud, hybrid-cloud architecture, or is using elements of a legacy-cloud environment. So many tools can result in data inconsistencies.
Findings provide insights into Kubernetes practitioners’ infrastructure preferences and how they use advanced Kubernetes platform technologies. Kubernetes infrastructure models differ between cloud and on-premises. Kubernetes infrastructure models differ between cloud and on-premises. Kubernetes moved to the cloud in 2022.
Also, these modern, cloud-native architectures produce an immense volume, velocity, and variety of data. Some companies are still using different tools for application performance monitoring, infrastructure monitoring, and log monitoring. Now, Dynatrace applies Davis, its AI engine, to monitor the new log sources.
For cloud operations teams, network performance monitoring is central in ensuring application and infrastructure performance. Network traffic growth is the main reason for increasing spending, largely because of the adoption of hybrid and multi-cloud architectures. The AI engine AI delivers precise answers about the IT environment.
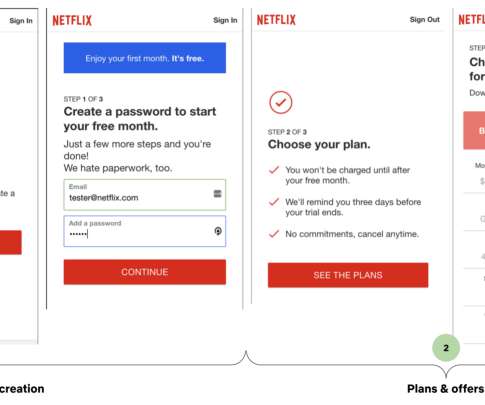
The Growth Engineering team is responsible for executing growth initiatives that help us anticipate and adapt to this change. For more background on Growth Engineering and the signup funnel, please have a look at our previous blog post that covers the basics. We need to be constantly adapting and innovating as a result of this change.
Log management and analytics is an essential part of any organization’s infrastructure, and it’s no secret the industry has suffered from a shortage of innovation for several years. Modern IT environments — whether multicloud, on-premises, or hybrid-cloud architectures — generate exponentially increasing data volumes.
Transform your operations today with the new Problems app and stay ahead in the ever-evolving software and cloud infrastructure landscape. In the realm of cloud infrastructure management, having a clear and concise view of your deployment’s health is crucial. The root cause is shown in the context of Infrastructure & Operations.
We organize all of the trending information in your field so you don't have to. Join 5,000+ users and stay up to date on the latest articles your peers are reading.
You know about us, now we want to get to know you!
Let's personalize your content
Let's get even more personalized
We recognize your account from another site in our network, please click 'Send Email' below to continue with verifying your account and setting a password.


Let's personalize your content