This site uses cookies to improve your experience. To help us insure we adhere to various privacy regulations, please select your country/region of residence. If you do not select a country, we will assume you are from the United States. Select your Cookie Settings or view our Privacy Policy and Terms of Use.
Cookie Settings
Cookies and similar technologies are used on this website for proper function of the website, for tracking performance analytics and for marketing purposes. We and some of our third-party providers may use cookie data for various purposes. Please review the cookie settings below and choose your preference.
Used for the proper function of the website
Used for monitoring website traffic and interactions
Cookie Settings
Cookies and similar technologies are used on this website for proper function of the website, for tracking performance analytics and for marketing purposes. We and some of our third-party providers may use cookie data for various purposes. Please review the cookie settings below and choose your preference.
Strictly Necessary: Used for the proper function of the website
Performance/Analytics: Used for monitoring website traffic and interactions
In fact, according to a Dynatrace global survey of 1,300 CIOs , 99% of enterprises utilize a multicloud environment and seven cloud monitoring solutions on average. What is cloud monitoring? Cloud monitoring is a set of solutions and practices used to observe, measure, analyze, and manage the health of cloud-based IT infrastructure.
Organizations are depending more and more on distributed architectures to provide application services. This trend is prompting advances in both observability and monitoring. But exactly what are the differences between observability vs. monitoring? Monitoring and observability provide a two-pronged approach.
Observability is the new standard of visibility and monitoring for cloud-native architectures. Requirements to achieve multicloud observability and monitoring. Environments with multiple cloud service providers that deploy microservices, containers, and Kubernetes systems require a more dynamic, modern approach to monitoring.
With the world’s increased reliance on digital services and the organizational pressure on IT teams to innovate faster, the need for DevOps monitoring tools has grown exponentially. But when and how does DevOps monitoring fit into the process? And how do DevOps monitoring tools help teams achieve DevOps efficiency?
As dynamic systems architectures increase in complexity and scale, IT teams face mounting pressure to track and respond to conditions and issues across their multi-cloud environments. What is the difference between monitoring and observability? Is observability really monitoring by another name? Dynatrace news. In short, no.
Over the past 18 months, the need to utilize cloud architecture has intensified. Teams can no longer effectively manage and secure today’s multicloud environments using traditional monitoring tools. IT professionals understand they need a new approach to monitoring and securing their environments.
Modernizing IT enables automation to work at scale For organizations with scarce resources and heavy workloads, automated workflows can enable IT teams to monitor, manage, secure, and troubleshoot applications at scale. Once created, teams can customize these automated operations to specific environments or scenarios as necessary.
They now use modern observability to monitor expanding cloud environments in order to operate more efficiently, innovate faster and more securely, and to deliver consistently better business results. There are simply too many disparate sources of information to successfully manage and monitor without automation.
As a result, while cloud architecture has enabled organizations to develop applications iteratively, it also increased exposure to vulnerabilities. Because of their flexibility, dynamic, ephemeral environments are more difficult to monitor in real time than traditional on-premises infrastructure. Automation for application security.
Monitoring and logging are fundamental building blocks of observability. When monitoring tools release a stream of alerts, teams can easily identify which ones are false and assess whether an event requires human intervention. Similarly, digital experience monitoring is another ongoing process that lends itself to IT automation.
As an example of what you can now achieve with Dynatrace monitoring of GCP, let’s take a look at the Google Cloud Function service. But the fact that there is no host to monitor makes this a challenge, especially if the failure rate is growing. Leverage Kubernetes to monitor GCP projects . Google Cloud Filestore.
As a result, developers and operations teams can automatically manage, monitor, and provision IT resources through software code rather than manually configure one device after another. As a result, Git becomes the single source of truth and control mechanism for creating, updating, and deleting system architecture dynamically.
However, while Kubernetes can help teams monitor the health of their environments and restart failed applications, the platform has limited visibility into the internal state of those applications. Get your free eBook now! More about Kubernetes.
Many customers try to use traditional tools to monitor and observe modern software stacks, but they struggle to deal with the dynamic and changing nature of cloud environments. When an application runs on a single large computing element, a single operating system can monitor every aspect of the system. Centralized applications.
Serverless architecture enables organizations to deliver applications more efficiently without the overhead of on-premises infrastructure, which has revolutionized software development. These tools simply can’t provide the observability needed to keep pace with the growing complexity and dynamism of hybrid and multicloud architecture.
AIOps and observability—or artificial intelligence as applied to IT operations tasks, such as cloud monitoring—work together to automatically identify and respond to issues with cloud-native applications and infrastructure. But applying the sense-think-act model for IT using AIOps and observability can make the difference. Act’ with AIOps.
During a breakout session at the Dynatrace Perform 2024 conference, Dynatrace DevSecOps activist Andreas Grabner and staff engineer Adam Gardner demonstrated how to use observability to monitor an IDP for key performance indicators (KPIs). Intelligent monitoring is also crucial. Observability is a critical component of an IDP.
Read our DevOps eBook – A Beginners Guide to DevOps Basics. Read eBook now! Organizations can also apply shift-right testing to code that gets configured or is monitored in the field. Why shift-right is critical for microservice architecture. Synthetic monitoring. Shift-right done right with full-stack monitoring.
Evaluating these on three levels—data center, host, and application architecture (plus code)—is helpful. Application architectures might not be conducive to rehosting. Thomas: “Not so fast, Klaus; this host is part of our Synthetic Monitoring node cluster. Is the solution to just move all workloads to the cloud?
What will the new architecture be? Session attendees will learn first-hand how Dynatrace natively integrates into the AWS Migration Hub to provide a full topology of on-prem workloads and dependencies in order to generate the ideal cloud-based architecture in the AWS cloud. What can we move?
With 99% of organizations using multicloud environments , effectively monitoring cloud operations with AI-driven analytics and automation is critical. In addition to improved IT operational efficiency at a lower cost, ITOA also enhances digital experience monitoring for increased customer engagement and satisfaction.
How is monitoring different from observability? Already in the 2000s, service-oriented architectures (SOA) became popular, and operations teams discovered the need to understand how transactions traverse through all tiers and how these tiers contributed to the execution time and latency. Observability vs. monitoring.
The growing challenge in modern IT environments is the exponential increase in log telemetry data, driven by the expansion of cloud-native, geographically distributed, container- and microservice-based architectures. The first best practice is to consolidate log management with application monitoring in a single platform.
OpenTelemetry reference architecture. Monitoring begins here. For a deeper look at Advanced Observability and how it can benefit your organization, take a look at Dynatrace’s eBook: Upgrade to advanced observability for answers in cloud-native environments. Read eBook now! Source: OpenTelemetry Documentation.
Traditional monitoring approaches worked fine when an operator was tasked with tracking a simple, static system,” wrote Ali Siddiqui in “ How to harness the power of observability, AIOps and automation.” And according to 451 Research, 83% of organizations plan to adapt their monitoring process. during 2021–2026.
In summary, the Dynatrace platform enables banks to do the following: Capture any data type: logs, metrics, traces, topology, behavior, code, metadata, network, security, web, and real-user monitoring data, and business events. Monitor and neutralize insider threats from negligent or malicious employees and contractors. Read now!
As more organizations are moving from monolithic architectures to cloud architectures, the complexity continues to increase. For more information about developing an AIOps strategy for cloud observability and how Dynatrace can help, read our eBook. Enhanced visibility. Make your business stronger with AI.
In practice, AI-driven solutions help reduce the burden on IT teams by allowing them to offload routine monitoring and management tasks so they can focus on mission-critical concerns. Despite all the benefits of modern cloud architectures, 63% of CIOs surveyed said the complexity of these environments has surpassed human ability to manage.
Check out our latest eBook to learn how to pick the right migration strategy. Read eBook now! As such, organizations need the ability to integrate and monitor activity across their hybrid- and multicloud environments. As a result, organizations are seeing improved availability and performance. Inconsistent performance.
Across the cloud operations lifecycle, especially in organizations operating at enterprise scale, the sheer volume of cloud-native services and dynamic architectures generate a massive amount of data. IT operations teams need ways to monitor infrastructure, even if it’s not within their data centers and under their direct management.
Teams often follow this approach to achieving AIOps because of its apparent convenience: Start with a second-generation application performance monitoring solution, which covers data collection and aggregation and prepares data for analysis. Analyze the data. Execute an action plan. Achieving autonomous operations.
Conventional (not built for cloud) monitoring tools are not much help. Weeks, if not months, can pass until the system is honed to completely trust it with production monitoring of business-critical processes. As your application contains literally millions of dependencies, how do you find the original error?
Disparate interfaces still require manual intervention and analysis, and in this way, traditional AIOps solutions have essentially become event monitoring tools. AIOps should instead leverage the ability of deterministic AI to fully map the topology of complex, distributed architectures to reach resolutions significantly faster.
Especially as software development continually evolves using microservices, containerized architecture, distributed multicloud platforms, and open-source code. The information Dynatrace gathers—such as the actual runtime topology of production environments—can be used for both performance monitoring and risk assessment.
The Collector , while not technically required, is an extremely useful component to the OpenTelemetry architecture because it allows greater flexibility for receiving and sending the application telemetry to the backend(s). This makes it easy to switch backends without the pain of re-instrumenting your code. . The post What is?OpenTelemetry??Everything
The Collector , while not technically required, is an extremely useful component to the OpenTelemetry architecture because it allows greater flexibility for receiving and sending the application telemetry to the backend(s). This makes it easy to switch backends without the pain of re-instrumenting your code. . The post What is?OpenTelemetry??Everything
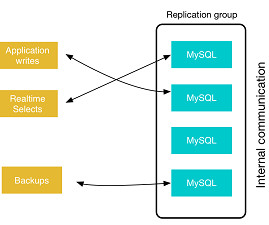
Monitoring and Maintenance: Regularly monitor replication status and logs. However, it’s important to consider potential downsides, including increased complexity in managing replicas, the potential for replication lag, and the need for monitoring and maintenance to ensure consistency and reliability across replicas.
These may be performance, high availability, operational cost, management, capacity planning, scalability, security, monitoring, etc. Download our eBook, “ Enterprise Guide to Cloud Databases ” to help you make more informed decisions and avoid costly mistakes as you develop and execute your cloud strategy.
The swap issue is explained in the excellent article by Jeremy Cole at the Swap Insanity and NUMA Architecture. It is recommended to lower this setting and monitor the impact on query performance and disk IO. Set the value to 60-70% and monitor the memory usage. The report focuses on MySQL, but it is valid for MongoDB as well.
A zero trust architecture (ZTA) model comprises seven pillars to enhance the security posture of all organizations, from government agencies to private sector enterprises. Continuous monitoring. Agencies should continuously monitor applications for any changes.
In protecting critical data and resources, ZT also establishes continuous multi-factor authentication, micro-segmentation, encryption, endpoint security, automation, and analytics, per the Department of Defense (DoD) Zero Trust Reference Architecture. “In Discover more in the latest ebook.
How observability helps IT protect modern environments As dynamic systems architectures increase in complexity and scale, IT teams face mounting pressure to track and respond to issues across their multicloud environments. Observability differs from monitoring.
We organize all of the trending information in your field so you don't have to. Join 5,000+ users and stay up to date on the latest articles your peers are reading.
You know about us, now we want to get to know you!
Let's personalize your content
Let's get even more personalized
We recognize your account from another site in our network, please click 'Send Email' below to continue with verifying your account and setting a password.


Let's personalize your content