This site uses cookies to improve your experience. To help us insure we adhere to various privacy regulations, please select your country/region of residence. If you do not select a country, we will assume you are from the United States. Select your Cookie Settings or view our Privacy Policy and Terms of Use.
Cookie Settings
Cookies and similar technologies are used on this website for proper function of the website, for tracking performance analytics and for marketing purposes. We and some of our third-party providers may use cookie data for various purposes. Please review the cookie settings below and choose your preference.
Used for the proper function of the website
Used for monitoring website traffic and interactions
Cookie Settings
Cookies and similar technologies are used on this website for proper function of the website, for tracking performance analytics and for marketing purposes. We and some of our third-party providers may use cookie data for various purposes. Please review the cookie settings below and choose your preference.
Strictly Necessary: Used for the proper function of the website
Performance/Analytics: Used for monitoring website traffic and interactions
Grafana Loki is a horizontally scalable, highly available log aggregation system. It is designed for simplicity and cost-efficiency. Created by Grafana Labs in 2018, Loki has rapidly emerged as a compelling alternative to traditional logging systems, particularly for cloud-native and Kubernetes environments.
Editor's Note: The following is an article written for and published in DZone's 2024 Trend Report, The Modern DevOps Lifecycle: Shifting CI/CD and Application Architectures. By integrating observability tools in CI/CD pipelines, organizations can increase deployment frequency, minimize risks, and build highly available systems.
Diagnosing issues within complex microservice architectures can quickly become a time-consuming and daunting task. For your reference, the complete working example is available on GitHub. As a Java developer, there's nothing more frustrating than dealing with sluggish application performance in production.
As an executive, I am always seeking simplicity and efficiency to make sure the architecture of the business is as streamlined as possible. With this unrestricted availability, organizations can gain insights significantly faster by consolidating data storage and analytics models into a single, standardized approach.
The nirvana state of system uptime at peak loads is known as “five-nines availability.” In its pursuit, IT teams hover over system performance dashboards hoping their preparations will deliver five nines—or even four nines—availability. But is five nines availability attainable? Downtime per year. 90% (one nine).
We innovatively use its snapshot feature to implement a primary-replica architecture for ClickHouse. This architecture ensures high availability and stability of the data while significantly enhancing system performance and data recovery capabilities.
Many organizations are taking a microservices approach to IT architecture. However, in some cases, an organization may be better suited to another architecture approach. Therefore, it’s critical to weigh the advantages of microservices against its potential issues, other architecture approaches, and your unique business needs.
As we did with IBM Power , we’re delighted to share that IBM and Dynatrace have joined forces to bring the Dynatrace Operator, along with the comprehensive capabilities of the Dynatrace platform, to Red Hat OpenShift on the IBM Z and LinuxONE architecture (s390x). Dynatrace observability is available for Red Hat OpenShift on IBM Power.
For reference: Checkout my previous article where I discuss connection pool high availability, " Connection Pool High Availability With CockroachDB and PgCat." Motivation The load balancer is a core piece of architecture for CockroachDB. Given its importance, I'd like to discuss the methods to overcome the SPOF scenarios.
We’re delighted to share that IBM and Dynatrace have joined forces to bring the Dynatrace Operator, along with the comprehensive capabilities of the Dynatrace platform, to Red Hat OpenShift on the IBM Power architecture (ppc64le).
We have developed a microservices architecture platform that encounters sporadic system failures when faced with heavy traffic events. System resilience stands as the key requirement for e-commerce platforms during scaling operations to keep services operational and deliver performance excellence to users.
Streamlining observability with Dynatrace OneAgent on AWS Image Builder In our ongoing collaboration with AWS, we’re excited to make the Dynatrace OneAgent available as a first-class integration on AWS Image Builder via the AWS Marketplace. This solution aligns to the AWS Well-Architected Framework.
Part 3: System Strategies and Architecture By: VarunKhaitan With special thanks to my stunning colleagues: Mallika Rao , Esmir Mesic , HugoMarques This blog post is a continuation of Part 2 , where we cleared the ambiguity around title launch observability at Netflix. The response schema for the observability endpoint.
Additionally, Dynatrace integrates relevant trace data, providing full visibility into complex, microservices-based architectures. Dynatrace provides a detailed view of application transactions across microservices architectures, enabling you to track requests from start to finish.
This article outlines the key differences in architecture, performance, and use cases to help determine the best fit for your workload. RabbitMQ follows a message broker model with advanced routing, while Kafkas event streaming architecture uses partitioned logs for distributed processing. What is RabbitMQ? What is Apache Kafka?
In this blog post, we explain what Greenplum is, and break down the Greenplum architecture, advantages, major use cases, and how to get started. It’s architecture was specially designed to manage large-scale data warehouses and business intelligence workloads by giving you the ability to spread your data out across a multitude of servers.
Implementing clustering and quorum queues in RabbitMQ significantly improves load distribution and data redundancy, ensuring high availability and fault tolerance for messaging services. This decoupling is crucial in modern architectures where scalability and fault tolerance are paramount.
Architecture Overview The first pivotal step in managing impressions begins with the creation of a Source-of-Truth (SOT) dataset. This dual availability ensures immediate processing capabilities alongside comprehensive long-term data retention. Thus, all data in one region is processed by the Flink job deployed within thatregion.
This scenario underscored the need for a new recommender system architecture where member preference learning is centralized, enhancing accessibility and utility across different models. Furthermore, it was difficult to transfer innovations from one model to another, given that most are independently trained despite using common data sources.
Boost your operational resilience: Combining availability and security is now essential. More technology, more complexity The benefits of cloud-native architecture for IT systems come with the complexity of maintaining real-time visibility into security compliance and risk posture.
Both categories share common requirements, such as high throughput and high availability. Eventually Consistent Global Counter While some users may accept the limitations of a Best-Effort counter, others opt for precise counts, durability and global availability.
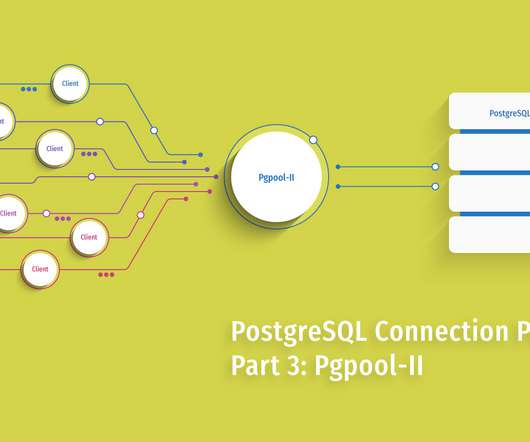
It supports high-availability, provides automated load balancing, and has the intelligence to balance load between masters and slaves so write loads are always directed at masters, while read loads are directed to slaves. Check out the Pgpool-II architecture that supports all of its features, and learn how the connection pooler works.
Grail architectural basics. The aforementioned principles have, of course, a major impact on the overall architecture. A data lakehouse addresses these limitations and introduces an entirely new architectural design. It’s based on cloud-native architecture and built for the cloud. But what does that mean?
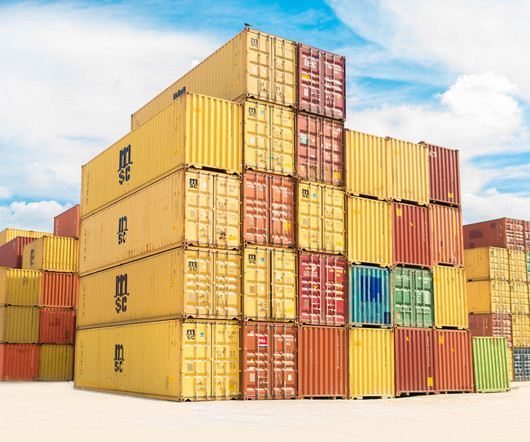
It is available for macOS, Windows, Linux Distributions, Windows Server 2016, AWS, Google Compute Platform, Azure, and IBM Cloud. However, it is essential to research the architecture of Docker to take full advantage of its features. Docker can be used across various cloud, desktop, and server platforms.
Cloud-native application development in AWS often requires complex, layered architecture with synchronous and asynchronous interactions between multiple components, e.g., API Gateway, Microservices, Serverless Functions, and system of record integration.
In today's rapidly evolving technology landscape, it's common for applications to migrate to the cloud to embrace the microservice architecture. While this architectural approach offers scalability, reusability, and adaptability, it also presents a unique challenge: effectively managing communication between these microservices.
To get a better understanding of AWS serverless, we’ll first explore the basics of serverless architectures, review AWS serverless offerings, and explore common use cases. Serverless architecture: A primer. Serverless architecture shifts application hosting functions away from local servers onto those managed by providers.
The fact is, Reliability and Resiliency must be rooted in the architecture of a distributed system. The subject line said: “Success Story: Major Issue in single AWS Frankfurt Availability Zone!” The problem started at 1:24PM PDT, with the services starting to become available again about 3 hours later.
Network Availability: The expected continued growth of our ecosystem makes it difficult to understand our network bottlenecks and potential limits we may be reaching. Flow Exporter The Flow Exporter is a sidecar that uses eBPF tracepoints to capture TCP flows at near real time on instances that power the Netflix microservices architecture.
As organizations increasingly migrate their applications to the cloud, efficient and scalable load balancing becomes pivotal for ensuring optimal performance and high availability. Load balancing is a critical component in cloud architectures for various reasons. What Is Load Balancing?
While both platforms share some similarities, they differ in architecture, scalability, high availability, container management, and learning curve. Two of the most popular container orchestration platforms today are Docker Swarm and Kubernetes.
One thing remains the same: maintaining your organization's architecture always requires both a vigilant outlook and an understanding of available open standards. Monitoring applications goes way beyond just writing and deploying code, especially in the cloud-native world.
OpenTelemetry Astronomy Shop demo application architecture diagram. All the needed components are available out of the box in the OpenTelemetry collector contrib distribution, which is included in the demo application. Next, select one of the log lines to view the available attributes. Courtesy of the OpenTelemetry authors.
Regarding contemporary software architecture, distributed systems have been widely recognized for quite some time as the foundation for applications with high availability, scalability, and reliability goals.
The Grail architecture ensures scalability, making log data accessible for detailed analysis regardless of volume. Since you can ingest Journald logs using Dynatrace OneAgent, this feature is available to customers of both the latest Dynatrace SaaS and Dynatrace Managed.
Limited data availability constrains value creation. Modern IT environments — whether multicloud, on-premises, or hybrid-cloud architectures — generate exponentially increasing data volumes. Even in cases where all data is available, new challenges can arise. Effective analytics with the Dynatrace Query Language. Create filters.
Microservices have become a popular architectural approach for building large-scale, complex systems. It acts as a safety mechanism that monitors the availability and responsiveness of dependent services. While asynchronous communication is often preferred in microservices, there are cases where synchronous communication is necessary.
With the availability of Linux on IBM Z and LinuxONE, the IBM Z platform brings a familiar host operating system and sustainability that could yield up to 75% energy reduction compared to x86 servers. You can now install OneAgent on Linux with s390 architecture. Next, set up log ingest.
Our colleagues wrote a Netflix Tech Blog post describing the details of this architecture. The transition to the new federated architecture meant that many of our backend teams needed to adopt GraphQL in our Java ecosystem. Backward compatibility is even more critical when working in a Federated GraphQL architecture.
After laying out the groundwork for this series in the initial article, I spent time sharing who the observability players are, looked at the ongoing discussion around monitoring pillars versus phases, shared thoughts on architectural level choices being made, and shared the open standards available within the open source landscape.
Arm architecture. Today, Google announced virtual machines (VMs) based on the Arm architecture on Compute Engine called Tau T2A , which are optimized for cost-effective performance for scale-out workloads, as well as GKE Arm. For some, that means looking to the? Why observability matters for GKE Arm clusters.
FaaS vs. monolithic architectures. Monolithic architectures were commonplace with legacy, on-premises software solutions. Increased availability. Because FaaS is a cloud-native approach, it makes great use of multisite cloud architecture to improve availability and reliability. Increased testing complexity.
We’re excited to announce that both Percona Server for MySQL and Percona XtraBackup now support the ARM64 architecture on Red Hat Enterprise Linux (RHEL) 8/9 and Oracle Linux (OL) 8/9. rpm file extension indicates that the RPM package is specifically built for the ARM64 architecture and intended […] The aarch64.rpm
Making Google’s CalDAV and CardDAV APIs available for everyone ( Google Developers Blog). Pandora launches new HTML5 site for TVs and gaming consoles, available now on PS3 and Xbox 360 ( The Next Web). Simpler UI Testing with CasperJS ( Architects Zone – Architectural Design Patterns & Best Practices). Hacker News).
We organize all of the trending information in your field so you don't have to. Join 5,000+ users and stay up to date on the latest articles your peers are reading.
You know about us, now we want to get to know you!
Let's personalize your content
Let's get even more personalized
We recognize your account from another site in our network, please click 'Send Email' below to continue with verifying your account and setting a password.


Let's personalize your content