This site uses cookies to improve your experience. To help us insure we adhere to various privacy regulations, please select your country/region of residence. If you do not select a country, we will assume you are from the United States. Select your Cookie Settings or view our Privacy Policy and Terms of Use.
Cookie Settings
Cookies and similar technologies are used on this website for proper function of the website, for tracking performance analytics and for marketing purposes. We and some of our third-party providers may use cookie data for various purposes. Please review the cookie settings below and choose your preference.
Used for the proper function of the website
Used for monitoring website traffic and interactions
Cookie Settings
Cookies and similar technologies are used on this website for proper function of the website, for tracking performance analytics and for marketing purposes. We and some of our third-party providers may use cookie data for various purposes. Please review the cookie settings below and choose your preference.
Strictly Necessary: Used for the proper function of the website
Performance/Analytics: Used for monitoring website traffic and interactions
Dynatrace and Microsoft extend leading observability and log analytics With the daunting amount of data enterprises must manage in the cloud, it’s become clear that observability is no longer optional. By prioritizing observability, organizations can ensure the availability, performance, and security of business-critical applications.
As a result, organizations are implementing security analytics to manage risk and improve DevSecOps efficiency. Fortunately, CISOs can use security analytics to improve visibility of complex environments and enable proactive protection. What is security analytics? Why is security analytics important? Here’s how.
The Dynatrace platform automatically captures and maps metrics, logs, traces, events, user experience data, and security signals into a single datastore, performing contextual analytics through a “power of three AI”—combining causal, predictive, and generative AI. The result?
Kafka is optimized for high-throughput event streaming , excelling in real-time analytics and large-scale data ingestion. This decoupling simplifies system architecture and supports scalability in distributed environments. Kafka achieves scalability by distributing topics across multiple partitions and replicating them among brokers.
The complexity of such deployments has accelerated with the adoption of emerging, open-source technologies that generate telemetry data, which is exploding in terms of volume, speed, and cardinality. How can we optimize for performance and scalability? Dynatrace extends its unique topology-based analytics and AIOps approach.
A traditional log-based SIEM approach to security analytics may have served organizations well in simpler on-premises environments. Security Analytics and automation deal with unknown-unknowns With Security Analytics, analysts can explore the unknown-unknowns, facilitating queries manually in an ad hoc way, or continuously using automation.
Today’s organizations flock to multicloud environments for myriad reasons, including increased scalability, agility, and performance. With unified observability and security, organizations can protect their data and avoid tool sprawl with a single platform that delivers AI-driven analytics and intelligent automation.
Greenplum Database is an open-source , hardware-agnostic MPP database for analytics, based on PostgreSQL and developed by Pivotal who was later acquired by VMware. This feature-packed database provides powerful and rapid analytics on data that scales up to petabyte volumes. Let’s walk through the top use cases for Greenplum: Analytics.
Grail needs to support security data as well as business analytics data and use cases. With that in mind, Grail needs to achieve three main goals with minimal impact to cost: Cope with and manage an enormous amount of data —both on ingest and analytics. High-performance analytics—no indexing required.
In what follows, we explore some key cloud observability trends in 2023, such as workflow automation and exploratory analytics. From data lakehouse to an analytics platform Traditionally, to gain true business insight, organizations had to make tradeoffs between accessing quality, real-time data and factors such as data storage costs.
An open-source distributed SQL query engine, Trino is widely used for data analytics on distributed data storage. Optimizing Trino to make it faster can help organizations achieve quicker insights and better user experiences, as well as cut costs and improve infrastructure efficiency and scalability. But how do we do that?
As end-to-end observability has become critical, we believe this placement reflects our commitment to delivering innovation that helps our customers solve their most complex business challenges with AI-powered observability, analytics, and automation.
In the People space, our data teams contribute to consolidated systems of record on employees, contractors, partners and talent data to help central teams manage headcount planning, reduce acquisition cost, improve hiring practices, and other people analytics related use-cases. Can we measure the impact of Inclusion and Diversity initiatives?
The old saying in the software development community, “You build it, you run it,” no longer works as a scalable approach in the modern cloud-native world. The ability to effectively manage multi-cluster infrastructure is critical to consistent and scalable service delivery. Automation, automation, automation.
This massive migration is critical to organizations’ digital transformation , placing cloud technology front and center and elevating the need for greater visibility, efficiency, and scalability delivered by a unified observability and security platform. The speed of change is only going to accelerate, thus requiring more innovation.
Our guide covers AI for effective DevSecOps, converging observability and security, and cybersecurity analytics for threat detection and response. Converging observability with security Multicloud environments offer a data haven of increased scalability, agility, and performance. Read now and learn more!
This improves query speeds and reduces related costs for all other teams and apps. Using buckets to query only the data you need significantly speeds up queries and reduces query costs. Keeping these logs separate decreases the data volume for other troubleshooting logs. This allows you to query data from a specific bucket.
Speed index. This will ensure you have the right skills, experience, and analytic power to implement the best digital experience monitoring strategy for your organization and goals. Visually complete. The time to fully render content in viewpoint. HTML downloaded. How quickly visible parts of the page are rendered. Load event start.
It is based on the IBM AS/400 system and is known for its reliability, scalability, and security features. Messages overview Monitor disks and disk pool utilization One of the most important functions of your mainframe infrastructure is reading and writing data at high speeds while making it readily available.
How this data-driven technique gives foresight to IT teams – blog By analyzing patterns and trends, predictive analytics enables teams to take proactive actions to prevent problems or capitalize on opportunities. What is predictive AI? What is AIOps?
According to one statistic, 76% of digital teams are responsible for delivering revenue , so software reliability and scalability are an increasing focus as these teams contribute to the bottom line. Software development success no longer means just meeting project deadlines. The five elements of digital immunity.
In our increasingly digital world, the speed of innovation is key to business success. As a result, e xisting application security approaches can’t keep up with this speed and vari ability of modern development processes. . Dynatrace news. Organizations are rushing towards cloud-native application stacks for agility.
Deriving business value with AI, IT automation, and data reliability When it comes to increasing business efficiency, boosting productivity, and speeding innovation, artificial intelligence takes center stage. And the ability to easily create custom apps enables teams to do any analytics at any time for any use case.
To do so we have successfully established AI-based White box load and resiliency testing with JMeter and Dynatrace, helping identify and resolve major performance and scalability problems in recent projects before deploying to production. Our customers usually involve us 2-4 weeks before the production release.
This article will help you understand the core differences in data structure, scalability, and use cases. MongoDB is a NoSQL database designed for unstructured data, offering flexibility and scalability with a schemaless architecture, making it suitable for applications needing rapid data handling.
Still, while DevOps and DevSecOps practices enable development agility and speed, they can also fall victim to tool complexity and data silos. Successful DevOps orchestration is a constant evolution of tools, processes, and communication on a journey to speed, stability, and scale. AIOps solution. But not all AI is created equal.
Join Etleap , an Amazon Redshift ETL tool to learn the latest trends in designing a modern analytics infrastructure. Learn what has changed in the analytics landscape and how to avoid the major pitfalls which can hinder your organization from growth. Register for the webinar today. The Solution to Your Operational Diagnostics Woes.
Join Etleap , an Amazon Redshift ETL tool to learn the latest trends in designing a modern analytics infrastructure. Learn what has changed in the analytics landscape and how to avoid the major pitfalls which can hinder your organization from growth. Register for the webinar today. The Solution to Your Operational Diagnostics Woes.
Such frameworks support software engineers in building highly scalable and efficient applications that process continuous data streams of massive volume. This high level of abstraction is provided by industry-grade, open source stream processing frameworks such as Kafka Streams , Apache Flink , and Spark Structured Streaming.
They need to create new products and maintain existing ones to deliver customer value at speed and scale while managing risk. It provides automatic scalability, runtime application security, secure connections and integrations across hybrid and multicloud ecosystems, and full lifecycle support, including security and quality certifications.
Without collecting logs from the observed platform in a scalable AI-powered data lakehouse like Grail, it’s more of a challenge to identify the root cause of problems and provide details for troubleshooting or security incidents. In this way, log data is always associated with the host, service, or other entity that generated it.
Join Etleap , an Amazon Redshift ETL tool to learn the latest trends in designing a modern analytics infrastructure. Learn what has changed in the analytics landscape and how to avoid the major pitfalls which can hinder your organization from growth. Register for the webinar today. The Solution to Your Operational Diagnostics Woes.
For heads of IT/Engineering responsible for building an analytics infrastructure , Etleap is an ETL solution for creating perfect data pipelines from day one. We found that High Scalability readers are about 80% more likely to be in the top bracket of engineering skill. The Solution to Your Operational Diagnostics Woes.
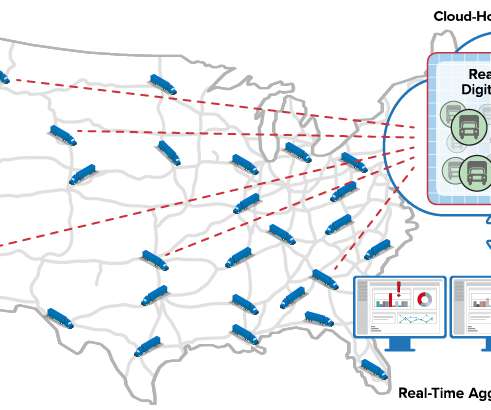
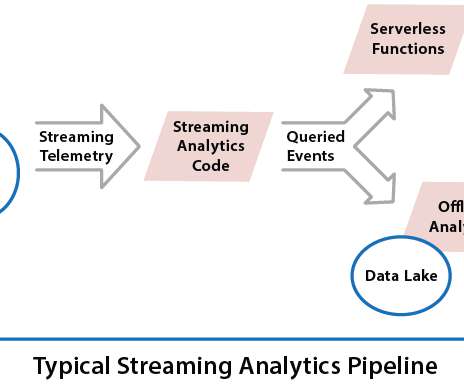
And how are they different from streaming pipelines like Azure Stream Analytics and Apache Flink/Beam? What Problems Does Streaming Analytics Solve? To understand why we need real-time digital twins for streaming analytics, we first need to look at what problems are tackled by popular streaming platforms.
To speed up release frequency, they’re investing in delivery-pipeline automation. The flip side of speeding up delivery, however, is that each software release comes with the risk of impacting your goals of availability, performance, or any business KPIs. Release decision making with Service-Level Objectives (SLOs).
Join Etleap , an Amazon Redshift ETL tool to learn the latest trends in designing a modern analytics infrastructure. Learn what has changed in the analytics landscape and how to avoid the major pitfalls which can hinder your organization from growth. Register for the webinar today. The Solution to Your Operational Diagnostics Woes.
Join Etleap , an Amazon Redshift ETL tool to learn the latest trends in designing a modern analytics infrastructure. Learn what has changed in the analytics landscape and how to avoid the major pitfalls which can hinder your organization from growth. Register for the webinar today. The Solution to Your Operational Diagnostics Woes.
To take full advantage of the scalability, flexibility, and resilience of cloud platforms, organizations need to build or rearchitect applications around a cloud-native architecture. Taken together, these features enable organizations to build software that is more scalable, reliable, and flexible than traditionally built software.
A more scalable option is to decouple these systems and build a pipe that connects these engines and feeds all change records from the source database to the data warehouse (e.g., Also, you can choose to program post-commit actions, such as running aggregate analytical functions or updating other dependent tables. DynamoDB Triggers.
Consider the typical, conventional streaming analytics pipeline available on popular cloud platforms: A conventional pipeline combines telemetry from all data sources into a single stream which is queried by the user’s streaming analytics application. However, real-time digital twins easily bring these capabilities within reach.
For heads of IT/Engineering responsible for building an analytics infrastructure , Etleap is an ETL solution for creating perfect data pipelines from day one. We found that High Scalability readers are about 80% more likely to be in the top bracket of engineering skill. The Solution to Your Operational Diagnostics Woes.
Such as INFO which gives statistics about the server, LATENCY LATEST which provides latency measurements in real time and MONITOR which allows observation of the clients transmitted command at live speed. Or even having limitations when trying vertical/horizontal scalability while ensuring availability at all times.
For heads of IT/Engineering responsible for building an analytics infrastructure , Etleap is an ETL solution for creating perfect data pipelines from day one. We found that High Scalability readers are about 80% more likely to be in the top bracket of engineering skill. The Solution to Your Operational Diagnostics Woes.
Join Etleap , an Amazon Redshift ETL tool to learn the latest trends in designing a modern analytics infrastructure. Learn what has changed in the analytics landscape and how to avoid the major pitfalls which can hinder your organization from growth. Register for the webinar today. The Solution to Your Operational Diagnostics Woes.
We organize all of the trending information in your field so you don't have to. Join 5,000+ users and stay up to date on the latest articles your peers are reading.
You know about us, now we want to get to know you!
Let's personalize your content
Let's get even more personalized
We recognize your account from another site in our network, please click 'Send Email' below to continue with verifying your account and setting a password.


Let's personalize your content