This site uses cookies to improve your experience. To help us insure we adhere to various privacy regulations, please select your country/region of residence. If you do not select a country, we will assume you are from the United States. Select your Cookie Settings or view our Privacy Policy and Terms of Use.
Cookie Settings
Cookies and similar technologies are used on this website for proper function of the website, for tracking performance analytics and for marketing purposes. We and some of our third-party providers may use cookie data for various purposes. Please review the cookie settings below and choose your preference.
Used for the proper function of the website
Used for monitoring website traffic and interactions
Cookie Settings
Cookies and similar technologies are used on this website for proper function of the website, for tracking performance analytics and for marketing purposes. We and some of our third-party providers may use cookie data for various purposes. Please review the cookie settings below and choose your preference.
Strictly Necessary: Used for the proper function of the website
Performance/Analytics: Used for monitoring website traffic and interactions
As user experiences become increasingly important to bottom-line growth, organizations are turning to behavior analytics tools to understand the user experience across their digital properties. Here’s what these analytics are, how they work, and the benefits your organization can realize from using them.
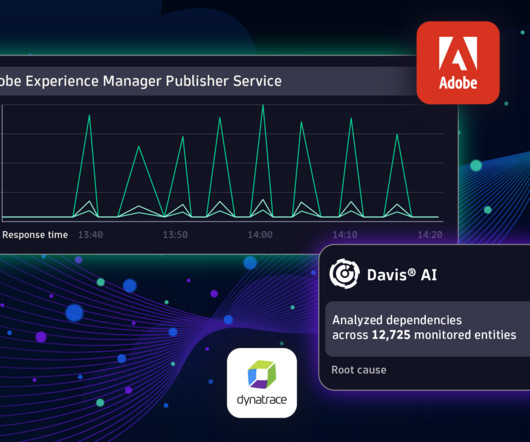
Ensuring smooth operations is no small feat, whether you’re in charge of application performance, IT infrastructure, or business processes. This is where Davis AI for exploratory analytics can make all the difference. Using a seasonal baseline, you can monitor sales performance based on the past fourteen days.
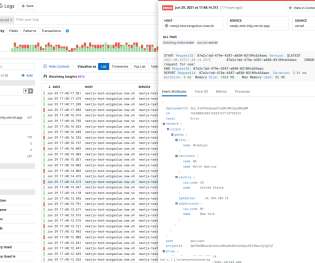
What is log analytics? Log analytics is the process of viewing, interpreting, and querying log data so developers and IT teams can quickly detect and resolve application and system issues. In what follows, we explore log analytics benefits and challenges, as well as a modern observability approach to log analytics.
What is log analytics? Log analytics is the process of viewing, interpreting, and querying log data so developers and IT teams can quickly detect and resolve application and system issues. In what follows, we explore log analytics benefits and challenges, as well as a modern observability approach to log analytics.
In his keynote address on the first day of Perform 2023 in Las Vegas, Dynatrace Chief Technology Officer Bernd Greifeneder and his colleagues discussed how organizations struggle with this problem and how Dynatrace is meeting the moment. Grail combines the big-data storage of a data warehouse with the analytical flexibility of a data lake.
To ensure unrivaled customer experience with your applications and websites, you need unrivaled levels of observability into your customers’ digital experiences. The post Ensure unrivaled customer experience with Davis AI-powered HTTP and custom error analytics appeared first on Dynatrace blog. Dynatrace news.
Improving The Performance Of Wix Websites (Case Study). Improving The Performance Of Wix Websites (Case Study). It was at this point that we realized we needed to make a significant change in our approach towards performance, and that we must embrace performance as part of our culture. Dan Shappir.
Web Performance is not only about understanding what makes a site fast. Performance is a feature and needs to be prioritized as such. Performance is a topic that has interested me for a long time. Moving over to web, the performance problems are different. This is not a post explaining why web performance is important.
In the 2023 Magic Quadrant for Application Performance Monitoring (APM) and Observability, Gartner has named Dynatrace a Leader and positioned it highest for Ability to Execute and furthest for Completeness of Vision. Although implementations are nascent, the security capabilities of APM and observability tools have proved to be valuable.
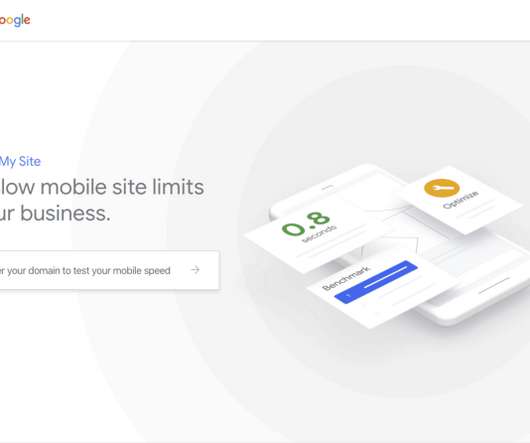
Web Performance is important for user experience and business metrics. This post explains several ways of assessing the potential performance gains with little effort and, more importantly, without actually implementing fixes. What is the business opportunity for web performance improvements? I would repeat over and over.
Logs assist operations, security, and development teams in ensuring the reliability and performance of application environments. These traditional approaches to log monitoring and log analytics thwart IT teams’ goal to address infrastructure performance problems, security threats, and user experience issues.
Application Performance Monitoring (APM) in its simplest terms is what practitioners use to ensure consistent availability, performance, and response times to applications. Websites, mobile apps, and business applications are typical use cases for monitoring. APM can also be referred to as: Application performance management.
At much less than 1% of CPU and memory on the instance, this highly performant sidecar provides flow data at scale for network insight. Cloud Network Insight is a suite of solutions that provides both operational and analytical insight into the cloud network infrastructure to address the identified problems.
Adobe Experience Manager empowers businesses to optimize and deliver engaging experiences across websites, mobile apps, and other touchpoints. By going beyond application performance monitoring with AI-powered, full stack observability, Dynatrace enables seamless end-to-end visibility.
These environments are marked by continuous delivery of microservice updates into production, the abstractions inherent in Kubernetes environments, and challenges associated with applications distributed across multicloud environments—often with performance and security risks. Download now! and/or its affiliates in the U.S.
Synthetic Monitoring is used to simulate defined customer behavior, for example when opening a website and clicking a certain button. Further reading about Business Analytics : . Digital Business Analytics. Digital Business Analytics: Let’s get started. Conclusion.
Don’t Sink Your Website With Third Parties. Don’t Sink Your Website With Third Parties. You’ve spent months putting together a great website design, crowd-pleasing content, and a business plan to bring it all together. Your website may be using more third-party services than you realize. Ken Harker.
here are a few reasons why; if you’re running a public website that your marketing is promoting, you have marketing campaigns running against your systems and you probably ran already into situations when you asked yourself, “Why is Dynatrace alerting me with high traffic on this specific page?!” Dynatrace news.
Application Performance Monitoring (APM) in its simplest terms is what practitioners use to ensure consistent availability, performance, and response times to applications. Websites, mobile apps, and business applications are typical use cases for monitoring. APM can be referred to as: Application performance monitoring.
While the curtains have fallen on Perform 2024 , the Dynatrace annual user conference, the commitment and collaborative nature of our partner relationships is consistently being demonstrated. The User Flow Analytics app was created to address real-life business challenges.
Possible scenarios A Distributed Denial of Service (DDoS) attack overwhelms servers with traffic, making a website or service unavailable. Possible scenarios A retail website crashes during a major sale event due to a surge in traffic. These attacks can be orchestrated by hackers, cybercriminals, or even state actors.
We love writing articles and blog posts that help folks solve real web performance and UX problems. Some of these articles come from our recently published Web Performance Guide – a collection of evergreen how-to resources (written by actual humans!) that will help you master website monitoring, analytics, and diagnostics.
Signals For Customizing Website User Experience. Signals For Customizing Website User Experience. In my last article , I suggested using the SaveData API to deliver a different, more performant, experience to users that expressed that desire. This is a bit of a shame, as I believe they are useful for websites.
Even at the most complex enterprise scale, AlloyDB for PostgreSQL delivers superior performance, four times faster than standard PostgreSQL for transactional workloads, and up to 100 times faster analytical queries than standard PostgreSQL. To learn more about Dynatrace and to start your free trial, visit the Dynatrace website.
At Dynatrace Perform 2023 , Ben Rushlo, Business Insights leader at Dynatrace, and Navid Mehdiabadi, BCLC’s APM expert, discuss how the right business insights are crucial to making data-driven decisions and improving business outcomes. They go on the website and play the games,” Mehdiabadi says.
These Use Cases include application health and performance monitoring (4.27/5), As end-to-end observability has become critical, we believe this placement reflects our commitment to delivering innovation that helps our customers solve their most complex business challenges with AI-powered observability, analytics, and automation.
To ensure unrivaled customer experience with your applications and websites, you need unrivaled levels of observability into your customers’ digital experiences. The post Ensure unrivaled customer experience with Davis AI-powered HTTP and custom error analytics appeared first on Dynatrace blog. Dynatrace news.
This could be adding high-quality graphics, running A/B testing to make UX tweaks, or deploying new code to make it perform better. On average 70% of users will abandon an online shopping cart; 12% of those due to website errors/crashes. All of it to make a frictionless experience for users. New to Dynatrace? Try our free trial !
Lessons Learned Rebuilding A Large E-Commerce Website With Next.js (Case Study). Lessons Learned Rebuilding A Large E-Commerce Website With Next.js (Case Study). From the moment we went live, we experienced performance issues. performance improvement can lead to a 10% increase in conversion. ESLint ,” official website.
It helps you identify errors, analyze areas of struggle, and provides tons of analytical data for your testing teams. These rules can be configured for individual web pages, entire websites, and even single-page applications. Session Replay enables you to capture and visually replay the complete digital experience of your end users.
Are Imposter Domains Re-Publishing Your Website? Are Imposter Domains Re-Publishing Your Website? We explore how you can use web analytics or real user measurement data on your website to get insight into any imposter domains re-publishing your work. Ken Harker. 2021-09-20T11:30:00+00:00. 2021-09-20T14:12:33+00:00.
Simultaneously, you’re constantly optimizing your website to meet your customers’ changing priorities. Yesterday’s nice-to-have is today’s must-have It was never ideal to rely exclusively on business intelligence or web analytics tools to discover poor business outcomes caused by friction in the purchase funnel. customers also?choose?to
But that’s difficult when Black Friday traffic brings overwhelming and unpredictable peak loads to retailer websites and exposes the weakest points in a company’s infrastructure, threatening application performance and user experience. Peak loads can overload and crash retailer websites and derail customer interactions.
Session replay is an IT technology that creates anonymized video-like recordings of actions taken by users interacting with your website or mobile application. Replay software also captures web assets such as CSS so it can create accurate recordings even if your website changes. Improved analytic context. What is session replay?
They collect data from multiple sources through real user monitoring , synthetic monitoring, network monitoring, and application performance monitoring systems. It also enables ITOps to identify performance issues in real time for fast mean time to detect/repair and to continuously optimize performance to improve the overall user experience.
For example, with AutomationEngine, teams can automate remediation and progressive delivery to continuously evaluate application performance against specific, measurable service-level objectives. In addition to the low-code/no-code AutomationEngine, Dynatrace announced a host of platform enhancements at Perform 2023 in Las Vegas.
How Improving WebsitePerformance Can Help Save The Planet. How Improving WebsitePerformance Can Help Save The Planet. But as it stands, websites are growing ever more obese, which means that the energy demand of the Internet is continuing to grow exponentially. Jack Lenox. 2019-01-15T13:30:32+01:00.
How Partytown Eliminates Website Bloat From Third-Party Apps. How Partytown Eliminates Website Bloat From Third-Party Apps. However, it’s not always easy to maintain high performance in websites. This is why performance is crucial when building websites. Steve Sewell. 2022-04-29T10:30:00+00:00.
Introducing the Web Performance Guide ! Business success Making your pages faster isn't just for the web performance geeks in your organization. This section gives you the data, tools, and tips to make everyone in your company care about how page speed affects your users and build a healthy culture of web performance.
Here’s a peek at the extension: Business observability Business observability refers to gaining insights into a business’s operation, performance, and behavior in real time. For example, consider an e-commerce website aiming to maximize sales.
Web Performance is important for user experience and business metrics. This post explains several ways of assessing the potential performance gains with little effort and, more importantly, without actually implementing fixes. What is the business opportunity for web performance improvements? I would repeat over and over.
User experience now defines website success. Ben Rushlo, Dynatrace Vice President of DEM Services, puts it this way: “As performance degrades, user experience degrades, engagement degrades, and business outcomes degrade.” ” The solution? What are Core Web Vitals? When do these metrics matter? Source: [link].
Amazon’s AWS monitoring and observability service, CloudWatch, monitors applications, resource usage, and system-wide performance for AWS-hosted environments. If a user encounters an error page on a website, for example, it’s vital to trace the behavior to the original source of failure. Amazon CloudWatch.
As a MySQL database administrator, keeping a close eye on the performance of your MySQL server is crucial to ensure optimal database operations. A monitoring tool like Percona Monitoring and Management (PMM) is a popular choice among open source options for effectively monitoring MySQL performance.
We organize all of the trending information in your field so you don't have to. Join 5,000+ users and stay up to date on the latest articles your peers are reading.
You know about us, now we want to get to know you!
Let's personalize your content
Let's get even more personalized
We recognize your account from another site in our network, please click 'Send Email' below to continue with verifying your account and setting a password.


Let's personalize your content