This site uses cookies to improve your experience. To help us insure we adhere to various privacy regulations, please select your country/region of residence. If you do not select a country, we will assume you are from the United States. Select your Cookie Settings or view our Privacy Policy and Terms of Use.
Cookie Settings
Cookies and similar technologies are used on this website for proper function of the website, for tracking performance analytics and for marketing purposes. We and some of our third-party providers may use cookie data for various purposes. Please review the cookie settings below and choose your preference.
Used for the proper function of the website
Used for monitoring website traffic and interactions
Cookie Settings
Cookies and similar technologies are used on this website for proper function of the website, for tracking performance analytics and for marketing purposes. We and some of our third-party providers may use cookie data for various purposes. Please review the cookie settings below and choose your preference.
Strictly Necessary: Used for the proper function of the website
Performance/Analytics: Used for monitoring website traffic and interactions
Chances are, youre a seasoned expert who visualizes meticulously identified key metrics across several sophisticated charts. This is where Davis AI for exploratory analytics can make all the difference. Your trained eye can interpret them at a glance, a skill that sets you apart.
As user experiences become increasingly important to bottom-line growth, organizations are turning to behavior analytics tools to understand the user experience across their digital properties. Here’s what these analytics are, how they work, and the benefits your organization can realize from using them.
This is where observability analytics can help. What is observability analytics? Observability analytics enables users to gain new insights into traditional telemetry data such as logs, metrics, and traces by allowing users to dynamically query any data captured and to deliver actionable insights.
Grail – the foundation of exploratory analytics Grail can already store and process log and business events. Now we’re adding Smartscape to DQL and two new data sources to Grail: Metrics on Grail and Traces on Grail. With Dynatrace and Smartscape for DQL, metrics are a completely different game.
What is customer experience analytics: Fostering data-driven decision making In today’s customer-centric business landscape, understanding customer behavior and preferences is crucial for success. The data should cover both quantitative metrics (e.g., Embrace advanced analytics techniques to unlock deeper insights.
The short answer: The three pillars of observability—logs, metrics, and traces—converging on a data lakehouse. Grail combines the big-data storage of a data warehouse with the analytical flexibility of a data lake. With Grail, we have reinvented analytics for converged observability and security data,” Greifeneder says.
What is log analytics? Log analytics is the process of viewing, interpreting, and querying log data so developers and IT teams can quickly detect and resolve application and system issues. In what follows, we explore log analytics benefits and challenges, as well as a modern observability approach to log analytics.
What is log analytics? Log analytics is the process of viewing, interpreting, and querying log data so developers and IT teams can quickly detect and resolve application and system issues. In what follows, we explore log analytics benefits and challenges, as well as a modern observability approach to log analytics.
With this Google Cloud Ready integration, Dynatrace ensures that AlloyDB for PostgreSQL users can now ingest metrics along with existing Google Cloud data. To learn more about Dynatrace and to start your free trial, visit the Dynatrace website.
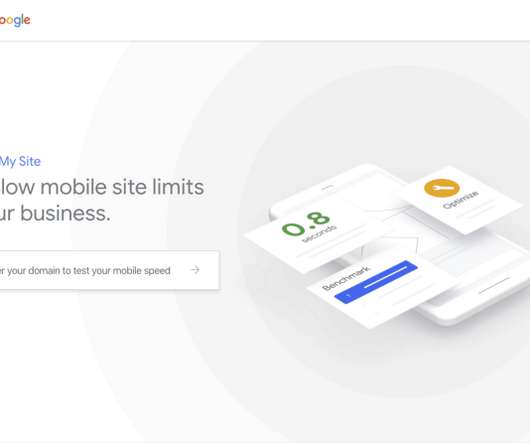
User experience now defines website success. Metrics that offer measurable, repeatable insight into the user experience from the moment they arrive on a website from a mobile or desktop device. Great user experiences start with Core Web Vitals (CWVs) — a set of metrics defined by Google to help measure user experience at scale.
To ensure unrivaled customer experience with your applications and websites, you need unrivaled levels of observability into your customers’ digital experiences. The post Ensure unrivaled customer experience with Davis AI-powered HTTP and custom error analytics appeared first on Dynatrace blog. Dynatrace news.
These traditional approaches to log monitoring and log analytics thwart IT teams’ goal to address infrastructure performance problems, security threats, and user experience issues. Achieving the ideal state with aggregated, centralized log data, metrics, traces , and other metadata is challenging—particularly for multicloud environments.
To make this possible, the application code should be instrumented with telemetry data for deep insights, including: Metrics to find out how the behavior of a system has changed over time. And because Dynatrace can consume CloudWatch metrics, almost all your AWS usage information is available to you within Dynatrace. Conclusion.
here are a few reasons why; if you’re running a public website that your marketing is promoting, you have marketing campaigns running against your systems and you probably ran already into situations when you asked yourself, “Why is Dynatrace alerting me with high traffic on this specific page?!” Dynatrace news.
Cloud Network Insight is a suite of solutions that provides both operational and analytical insight into the cloud network infrastructure to address the identified problems. In some ways, eBPF does to the kernel what JavaScript does to websites: it allows all sorts of new applications to be created.
Defining a comprehensive user-experience metric gives rise to questions such as: How do we compare the user experience of one session to another? Which metric can be used for the purpose of reporting user experience and tracking it over a period of time? A single metric for user experience segmentation. Error metrics.
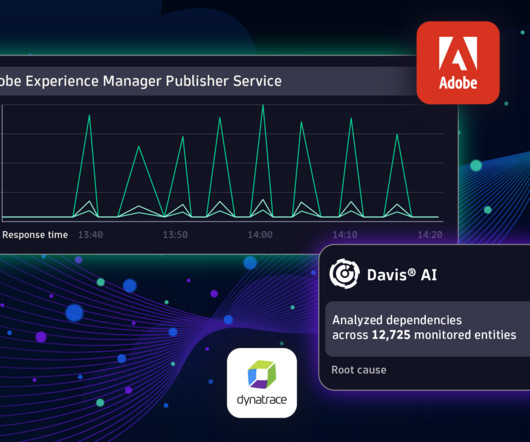
Adobe Experience Manager empowers businesses to optimize and deliver engaging experiences across websites, mobile apps, and other touchpoints. Dynatrace automatically detects all Adobe Experience Manager applications and visualizes their dependencies—from the website, to the container, to the cloud service.
Improving The Performance Of Wix Websites (Case Study). Improving The Performance Of Wix Websites (Case Study). Since implementing these changes, we have seen a dramatic improvement in the performance of websites built and hosted on our platform. Dan Shappir. 2021-11-22T10:30:00+00:00. 2021-11-22T11:06:56+00:00.
Define monitoring goals and user experience metrics Next, define what aspects of a digital experience you want to monitor and improve — such as website performance, application responsiveness, or user engagement — and prioritize what to measure for each application. The time it takes to begin the page’s load event.
One-click activation of log collection and Azure Monitor metric collection in the Microsoft Azure Portal allows instant ingest of Azure Monitor logs and metrics into the Dynatrace platform. Notebooks offers advanced Azure observability analytics with DQL. There’s no need for configuration or setup of any infrastructure.
Dynatrace business events provide precise, real-time business metrics that support fine-grained business decisions and auditable business reporting. Business data is more than metrics Dynatrace ActiveGate extensions allow you to extend Dynatrace monitoring to any remote technology that exposes an interface.
Like general observability , AWS observability is the capacity to measure the current state of your AWS environment based on the data it generates, including its logs, metrics, and traces. If a user encounters an error page on a website, for example, it’s vital to trace the behavior to the original source of failure.
Simultaneously, you’re constantly optimizing your website to meet your customers’ changing priorities. Yesterday’s nice-to-have is today’s must-have It was never ideal to rely exclusively on business intelligence or web analytics tools to discover poor business outcomes caused by friction in the purchase funnel.
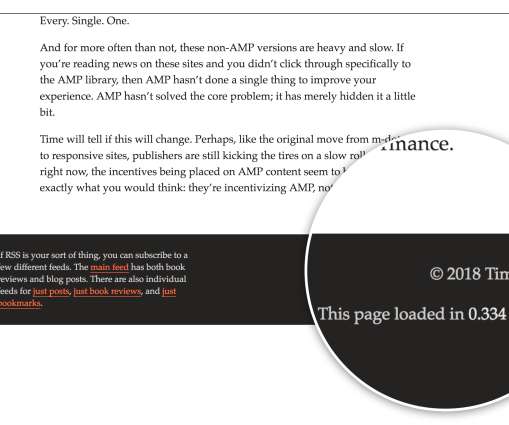
I was browsing Tim Kadlec’s website and I noticed he had added page load time metrics in the footer. If your browser supports the Paint Timing API you will see a couple of extra metrics: First Paint and First Contentful Paint. First Paint and First Contentful Paint Page load time is a metric that tells us part of the story.
Web Performance is important for user experience and business metrics. Look, there are many case studies proving a correlation between loading time and business metrics!” ?-?I Plotting Business Metrics vs Performance Metrics Think about what you are trying to drive on your existing site. I would repeat over and over.
On average 70% of users will abandon an online shopping cart; 12% of those due to website errors/crashes. Dynatrace Business Analytics is powered by Dynatrace Real User Monitoring (RUM) , Dynatrace PurePaths , and external metrics ingested through the Dynatrace API. All of it to make a frictionless experience for users.
Business Insights is a managed offering built on top of Dynatrace’s digital experience and business analytics tools. The Business Insights team helps customers manage or configure their digital experience environment, extend the Dynatrace platform through data analytics, and bring human expertise into optimization.
Observability Observability is the ability to determine a system’s health by analyzing the data it generates, such as logs, metrics, and traces. There are three main types of telemetry data: Metrics. Metrics are typically aggregated and stored in time series databases for monitoring and alerting purposes.
To ensure unrivaled customer experience with your applications and websites, you need unrivaled levels of observability into your customers’ digital experiences. The post Ensure unrivaled customer experience with Davis AI-powered HTTP and custom error analytics appeared first on Dynatrace blog. Dynatrace news.
Signals For Customizing Website User Experience. Signals For Customizing Website User Experience. In this article, I want to spend a bit more time on this, and also look at other signals we can similarly use to help us make decisions on what to load on our websites. Barry Pollard. 2022-03-07T10:30:00+00:00. save the user’s data!
Don’t Sink Your Website With Third Parties. Don’t Sink Your Website With Third Parties. You’ve spent months putting together a great website design, crowd-pleasing content, and a business plan to bring it all together. Your website may be using more third-party services than you realize. Ken Harker.
Dynatrace provides AWS Lambda metrics monitoring in less than five minutes, showing the function CPU, memory, and network health metrics all the way through to the process level. Simplify error analytics. To learn more about Dynatrace and to start your free trial, visit the Dynatrace website. How does Dynatrace help?
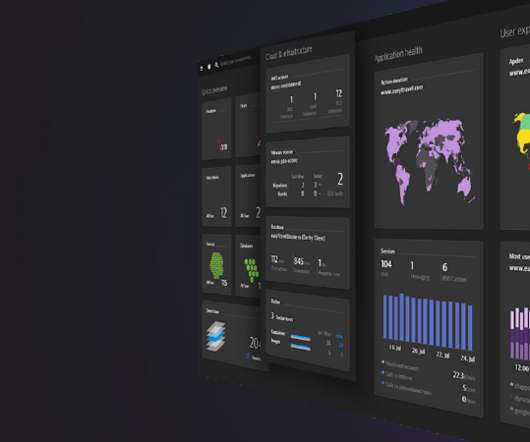
Websites, mobile apps, and business applications are typical use cases for monitoring. Dynatrace provides out-of-the box complete observability for dynamic cloud environment, at scale and in-context, including metrics, logs, traces, entity relationships, UX and behavior in a single platform. Advanced Cloud Observability.
A digital touchpoint may be a mobile application, a website, a smart TV, ATM, airport check-in kiosk, point-of-sale terminal, and so on. Because of everything that can go wrong, it’s imperative for organizations to constantly track metrics that indicate user satisfaction and have a robust complaint resolution model in place.
These can include business metrics, such as conversion rates, uptime, and availability; service metrics, such as application performance; or technical metrics, such as dependencies to third-party services, underlying CPU, and the cost of running a service. availability of a website over a year, your error budget is.05%.
Additionally, we’ve been able to unify dev teams and business teams to set and monitor metrics around user interaction with our sites.” VP operations, banking sector Complimentary copies of the 2023 Gartner Magic Quadrant for APM and Observability are available on the Dynatrace website. Download now!
Session replay is an IT technology that creates anonymized video-like recordings of actions taken by users interacting with your website or mobile application. Replay software also captures web assets such as CSS so it can create accurate recordings even if your website changes. Improved analytic context. What is session replay?
A digital touchpoint may be a mobile application, a website, a SmartTV app, an ATM, an airport check-in kiosk or similar. The platform has rich capabilities like Digital Business Analytics , Session Replay , Real User Monitoring ,… that allow you to capture the right metrics and communicate without friction. Dynatrace news.
The Dynatrace Grail data lakehouse enables teams to ingest logs, metrics, traces, business events, and other data to get a full picture of their hybrid and multicloud environments. For more on AutomationEngine, visit our website.
How Partytown Eliminates Website Bloat From Third-Party Apps. How Partytown Eliminates Website Bloat From Third-Party Apps. However, it’s not always easy to maintain high performance in websites. Even if your website is designed with usability in mind, these factors impede users from fully benefiting from the website’s features.
Metrics to find out how the behavior of a system has changed over time . And b ecause Dynatrace can consume CloudWatch metrics, almost all your AWS usage information is a vailable to you with in Dynatrace. . Further reading about Business Analytics : . Digital Business Analytics. Conclusion.
As I mentioned, we live in a world where massive volumes of data are being generated, every day, from connected devices, websites, mobile apps, and customer applications running on top of AWS infrastructure. Collaboration and sharing of live analytics : Users often want to slice and dice their data and share it in various ways.
The Speed Report in the Google Search Console (recently renamed “Core Web Vitals”) is offering two new performance metrics: Cumulative Layout Shift and Largest Contentful Paint additionally to the First Input Delay. Core Web Vitals have also been deployed in tools such as Page Speed Insights or Lighthouse.
I was browsing Tim Kadlec’s website and I noticed he had added page load time metrics in the footer. If your browser supports the Paint Timing API you will see a couple of extra metrics: First Paint and First Contentful Paint. First Paint and First Contentful Paint Page load time is a metric that tells us part of the story.
We organize all of the trending information in your field so you don't have to. Join 5,000+ users and stay up to date on the latest articles your peers are reading.
You know about us, now we want to get to know you!
Let's personalize your content
Let's get even more personalized
We recognize your account from another site in our network, please click 'Send Email' below to continue with verifying your account and setting a password.


Let's personalize your content