This site uses cookies to improve your experience. To help us insure we adhere to various privacy regulations, please select your country/region of residence. If you do not select a country, we will assume you are from the United States. Select your Cookie Settings or view our Privacy Policy and Terms of Use.
Cookie Settings
Cookies and similar technologies are used on this website for proper function of the website, for tracking performance analytics and for marketing purposes. We and some of our third-party providers may use cookie data for various purposes. Please review the cookie settings below and choose your preference.
Used for the proper function of the website
Used for monitoring website traffic and interactions
Cookie Settings
Cookies and similar technologies are used on this website for proper function of the website, for tracking performance analytics and for marketing purposes. We and some of our third-party providers may use cookie data for various purposes. Please review the cookie settings below and choose your preference.
Strictly Necessary: Used for the proper function of the website
Performance/Analytics: Used for monitoring website traffic and interactions
With Dynatrace, customers can utilize the full set of Azure capabilities, including metrics and data from the Azure platform, and automatically identify workflow optimization opportunities. By prioritizing observability, organizations can ensure the availability, performance, and security of business-critical applications.
We introduced Digital Business Analytics in part one as a way for our customers to tie business metrics to application performance and user experience, delivering unified insights into how these metrics influence business milestones and KPIs. A sample Digital Business Analytics dashboard. Dynatrace news.
In IT and cloud computing, observability is the ability to measure a system’s current state based on the data it generates, such as logs, metrics, and traces. If you’ve read about observability, you likely know that collecting the measurements of logs, metrics, and distributed traces are the three key pillars to achieving success.
Log monitoring, log analysis, and log analytics are more important than ever as organizations adopt more cloud-native technologies, containers, and microservices-based architectures. What is log analytics? Log analytics is the process of evaluating and interpreting log data so teams can quickly detect and resolve issues.
Amazon Bedrock , equipped with Dynatrace Davis AI and LLM observability , gives you end-to-end insight into the Generative AI stack, from code-level visibility and performance metrics to GenAI-specific guardrails. Send unified data to Dynatrace for analysis alongside your logs, metrics, and traces.
Dynatrace offers essential analytics and automation to keep applications optimized and businesses flourishing. By seamlessly integrating observability, AI-driven insights, and data analytics, organizations can overcome common obstacles such as operational inefficiencies, performance bottlenecks, and scalability concerns. Learn more.
In this blog post, we’ll use Dynatrace Security Analytics to go threat hunting, bringing together logs, traces, metrics, and, crucially, threat alerts. Dynatrace Grail is a data lakehouse that provides context-rich analytics capabilities for observability, security, and business data.
A full-stack observability solution uses telemetry data such as logs, metrics, and traces to give IT teams insight into application, infrastructure, and UX performance. With improved diagnostic and analytic capabilities, DevOps teams can spend less time troubleshooting. Watch webinar now! Watch webinar now!
Metrics, logs , and traces make up three vital prongs of modern observability. Together with metrics, three sources of data help IT pros identify the presence and causes of performance problems, user experience issues, and potential security threats. Comparing log monitoring, log analytics, and log management.
For a deeper look into how to gain end-to-end observability into Kubernetes environments, tune into the on-demand webinar Harness the Power of Kubernetes Observability. Watch webinar now! An orchestration platform needs to expose data about its internal states and activities in the form of logs, events, metrics, or transaction traces.
We believe this placement recognizes Dynatrace’s leadership in applying AI, automation, and advanced analytics to business and operations use cases to provide predictive and prescriptive answers to IT issues in real time. Other strengths include microservices, transaction, and customer experience (CX) monitoring, and intelligent analytics.
They’re unleashing the power of cloud-based analytics on large data sets to unlock the insights they and the business need to make smarter decisions. From a technical perspective, however, cloud-based analytics can be challenging. That’s especially true of the DevOps teams who must drive digital-fueled sustainable growth.
The hotel’s rental subsidiary limits their IT monitoring to internal system metrics, with no visibility into user journeys or business transactions. Note the business observability realized by extracting business metrics and segmentation – including conversions, revenue, product, and audience segments – from Dynatrace-monitored user sessions.
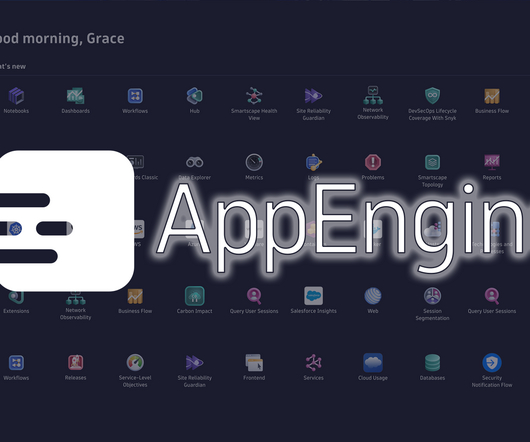
App developers have the same limitless possibilities for creating customized analytics and integrations in any IT environment, whether in the cloud or on-premises. In the meantime, look for upcoming webinars sharing more insights on the app offering of the Dynatrace platform and how to build your own custom apps.
These can include business metrics, such as conversion rates, uptime, and availability; service metrics, such as application performance; or technical metrics, such as dependencies to third-party services, underlying CPU, and the cost of running a service. Watch webinar now! What are SLIs? Why are SLOs important?
API monitoring captures and analyzes metrics that describe the vital aspects of an application’s performance, which can help developers gain a deeper understanding of the health and efficiency of the APIs they’re utilizing. Watch webinar now! The need for API monitoring. Ways to monitor APIs.
How this data-driven technique gives foresight to IT teams – blog By analyzing patterns and trends, predictive analytics enables teams to take proactive actions to prevent problems or capitalize on opportunities. The short answer: The three pillars of observability—logs, metrics, and traces—concentrated in a data lakehouse.
Yesterday’s nice-to-have is today’s must-have It was never ideal to rely exclusively on business intelligence or web analytics tools to discover poor business outcomes caused by friction in the purchase funnel. The good news is that it’s easy—as a Dynatrace customer—to include your business goals and metrics on your Dynatrace dashboards.
So, I figured it’s about time I summarized the top reasons why you as an ITOps person need to look beyond your typical IT sources – logs, metrics and traces – which are these days known as Observability data. Tightening the communication within BizDevOps with Adobe Analytics & Dynatrace.
Because of everything that can go wrong, it’s imperative for organizations to constantly track metrics that indicate user satisfaction and have a robust complaint resolution model in place. Without agreeing on the single source of truth, you’ll end up in meetings arguing about metrics instead of helping your users.
In the workshop, I also answered the question: How can we measure those metrics (=SLIs) that are behind our objectives? Whether its our Metrics Ingest API or building a Dynatrace Extension. Dynatrace’s RUM for Mobile Apps provides crash analytics by default. Mobile app rating is a good example of Objective Driven Development.
” Here, collecting metrics and monitoring performance help evaluate the efficacy of services rather than simply identifying their state. Watch webinar! While this basic information is essential, it provides no insight into the root causes of anomalies or the specific remedies required to resolve, let alone prevent, disruptions.
It started as an observability platform; over time, it has expanded to provide real user monitoring, business analytics, and security insights. The good news is, there are metrics available a few days before the attack was detected and Ludo Clinic has also ingested three months of application and access logs into Grail.
Captures metrics, traces, logs, and other telemetry data in context. Smartscape topology mapping: Dynatrace uses its Smartscape technology to semantically map metrics, traces, logs, and real user data to specific Kubernetes objects, including containers, pods, nodes, and services. Check out this webinar. New to Dynatrace?
Join Etleap , an Amazon Redshift ETL tool to learn the latest trends in designing a modern analytics infrastructure. Learn what has changed in the analytics landscape and how to avoid the major pitfalls which can hinder your organization from growth. Register for the webinar today. Advertise your event here!
Join Etleap , an Amazon Redshift ETL tool to learn the latest trends in designing a modern analytics infrastructure. Learn what has changed in the analytics landscape and how to avoid the major pitfalls which can hinder your organization from growth. Register for the webinar today. Advertise your event here!
Improved analytic context. While data analysis tools such as Google Analytics provide statistics based on user experiences, they lack details about what the user is doing and experiencing. This step is critical because the metrics needed to achieve these goals differ. Watch webinar now! Ready to master session replay?
A comprehensive, modern approach to AIOps is a unified platform that encompasses observability, AI, and analytics. Traditional AIOps is limited in the types of inferences it can make because it depends on metrics, logs, and trace data without a model of how components of systems are structured. The deviating metric is response time.
Join Etleap , an Amazon Redshift ETL tool to learn the latest trends in designing a modern analytics infrastructure. Learn what has changed in the analytics landscape and how to avoid the major pitfalls which can hinder your organization from growth. Register for the webinar today. Advertise your event here!
Join Etleap , an Amazon Redshift ETL tool to learn the latest trends in designing a modern analytics infrastructure. Learn what has changed in the analytics landscape and how to avoid the major pitfalls which can hinder your organization from growth. Register for the webinar today. Advertise your event here!
Join Etleap , an Amazon Redshift ETL tool to learn the latest trends in designing a modern analytics infrastructure. Learn what has changed in the analytics landscape and how to avoid the major pitfalls which can hinder your organization from growth. Register for the webinar today. Advertise your event here!
Join Etleap , an Amazon Redshift ETL tool to learn the latest trends in designing a modern analytics infrastructure. Learn what has changed in the analytics landscape and how to avoid the major pitfalls which can hinder your organization from growth. Register for the webinar today. Advertise your event here!
Second, reporting and metrics. Integration can help unify the information in one place (either a Jira or a database), so you can run reports and analytics across all of your teams. Integration will help make your work and connections visible, so everyone always knows what they are supposed to be working on and the status of any work.
This includes building websites, hosting websites, managing campaigns, SEO, analytics, CRM, and much more. Better tooling and metrics standardization. But which metrics should be measured in order to determine website performance? The three metrics are: LCP : Largest Contentful Paint (measures visibility).
Last week, Dr. Mik Kersten and Felipe Castro addressed these challenges head-on during a webinar on Transformative OKRs: Translating Business Strategy into Measurable Outcomes. Watch the full OKR webinar here. With hundreds of attendees on the webinar, the Q&A was lively. How are Flow Metrics related to OKRs? .
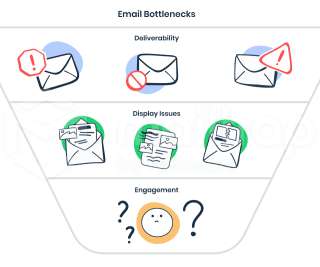
Are You Keeping On Top Of Your Email Metrics? With any type of email you send, you need to track at least these metrics: Open rate. It provides inbox placement, reputation check, DMARC analytics, bounce analytics, automatic tests, monitoring and alerts, and template editor. vf, yk, il).
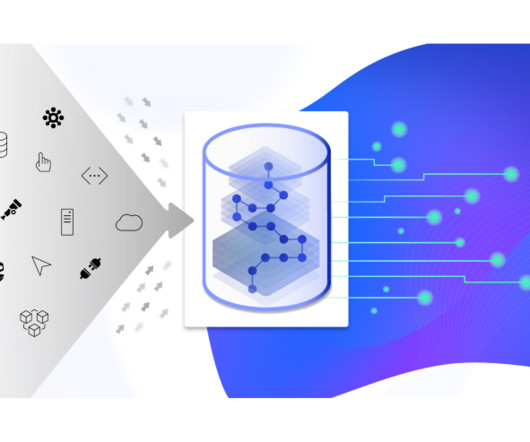
Grail – the foundation of exploratory analytics Grail can already store and process log and business events. Now we’re adding Smartscape to DQL and two new data sources to Grail: Metrics on Grail and Traces on Grail. With Dynatrace and Smartscape for DQL, metrics are a completely different game.
In a hypercompetitive business environment and the post-pandemic world, successful retailers will need to be applying data and analytics at every chance to differentiate products and customer experiences. Watch our webinar on-demand here. The trouble is most retailers are feasting on data, but they are starving for insight.
We organize all of the trending information in your field so you don't have to. Join 5,000+ users and stay up to date on the latest articles your peers are reading.
You know about us, now we want to get to know you!
Let's personalize your content
Let's get even more personalized
We recognize your account from another site in our network, please click 'Send Email' below to continue with verifying your account and setting a password.


Let's personalize your content