This site uses cookies to improve your experience. To help us insure we adhere to various privacy regulations, please select your country/region of residence. If you do not select a country, we will assume you are from the United States. Select your Cookie Settings or view our Privacy Policy and Terms of Use.
Cookie Settings
Cookies and similar technologies are used on this website for proper function of the website, for tracking performance analytics and for marketing purposes. We and some of our third-party providers may use cookie data for various purposes. Please review the cookie settings below and choose your preference.
Used for the proper function of the website
Used for monitoring website traffic and interactions
Cookie Settings
Cookies and similar technologies are used on this website for proper function of the website, for tracking performance analytics and for marketing purposes. We and some of our third-party providers may use cookie data for various purposes. Please review the cookie settings below and choose your preference.
Strictly Necessary: Used for the proper function of the website
Performance/Analytics: Used for monitoring website traffic and interactions
Exploratory analytics with collaborative analytics capabilities can be a lifeline for CloudOps, ITOps, site reliability engineering, and other teams struggling to access, analyze, and conquer the never-ending deluge of big data. These analytics can help teams understand the stories hidden within the data and share valuable insights.
This is where observability analytics can help. What is observability analytics? Observability analytics enables users to gain new insights into traditional telemetry data such as logs, metrics, and traces by allowing users to dynamically query any data captured and to deliver actionable insights. Put simply, context is king.
As user experiences become increasingly important to bottom-line growth, organizations are turning to behavior analytics tools to understand the user experience across their digital properties. Here’s what these analytics are, how they work, and the benefits your organization can realize from using them.
Increasingly, organizations seek to address these problems using AI techniques as part of their exploratory data analytics practices. The next challenge is harnessing additional AI techniques to make exploratory data analytics even easier. Notebooks] is purposely built to focus on data analytics,” Zahrer said. “We
Grail – the foundation of exploratory analytics Grail can already store and process log and business events. Let Grail do the work, and benefit from instant visualization, precise analytics in context, and spot-on predictive analytics. You no longer need to split, distribute, or pre-aggregate your data.
Accelerate data exploration with seamless integration between apps In developing the new Dynatrace experience, our goal was to integrate apps seamlessly by sharing the context when navigating between them (known as “intent”), much like sharing a photo from your smartphone to social media.
Greenplum Database is an open-source , hardware-agnostic MPP database for analytics, based on PostgreSQL and developed by Pivotal who was later acquired by VMware. This feature-packed database provides powerful and rapid analytics on data that scales up to petabyte volumes. Let’s walk through the top use cases for Greenplum: Analytics.
User Feed Service, Media Counter Service) read the actions from the streaming data store and performs their specific tasks. media search index, locations search index, and so forth) in future. For instance, the LikeEvent can be read by the Media Counter Service and is used to update the media count in the data storage.
How To Boost Media Performance On A Budget. How To Boost Media Performance On A Budget. Unquestionably, media enlivens websites, adding appeal, excitement, and intrigue, let alone enticements to stay on a page and frequently revisit it. Of the many factors that affect page-load speed, media is a significant one.
Reducing The Web’s Carbon Footprint: Optimizing Social Media Embeds. Reducing The Web’s Carbon Footprint: Optimizing Social Media Embeds. The Impact Of Social Media Embeds. Third-party Javascript accounts for a lot of bloat on websites, with analytics, chatbots, and embedded widgets being common contributors. Webmentions.
Exploratory analytics is an essential capability for organizations to discover the stories hiding in their data. Visual data analytics with collaborative input from IT, development, security, and business teams makes those stories reveal themselves and helps teams immediately understand—and act on—their business impact.
All data should be also available for offline analytics in Hive/Iceberg. Our team, Asset Management Platform, owns a different service that has a json based DSL to describe the schema of a media asset. Our architecture makes it possible to easily onboard and ingest data from Media algorithms. Currently the service has around 1.9
In our latest research, we analyzed social media, blogs, and other online sources to identify early indicators of such vulnerabilities. See our documentation for more details about detecting and managing third-party vulnerabilities with Dynatrace and to learn more about Dynatrace Runtime Vulnerability Analytics.
To scale to a larger number of users and support the growth in data volume spurred by social media, web, mobile, IoT, ad-tech, and ecommerce workloads, these tools require customers to invest in even more infrastructure to maintain performance. While QuickSight supports multiple graph types (e.g., How you can get started.
CORE The CORE team uses Python in our alerting and statistical analytical work. We’ve developed a time series correlation system used both inside and outside the team as well as a distributed worker system to parallelize large amounts of analytical work to deliver results quickly.
When Reloaded was designed, we focused on a single use case: converting high-quality media files (also known as mezzanines) received from studios into compressed assets for Netflix streaming. To achieve this, Cosmos was developed as a computing platform for workflow-driven, media-centric microservices.
AWS is enabling innovations in areas such as healthcare, automotive, life sciences, retail, media, energy, robotics that it is mind boggling and humbling. Many of these innovations will have a significant analytics component or may even be completely driven by it. Cloud analytics are everywhere.
PHP is widely used in web development by prominent social media companies, content management systems, and video teleconferencing brands. The open-source scripting language PHP is used by over 78% of all websites that use a server-side programming language. It ranks eighth in terms of GitHub pull requests statistics.
Every day we access applications to shop online, stream TV shows, connect to social media, manage finances, and work. User Experience and Business Analytics ery user journey and maximize business KPIs. Performance monitoring. Application monitoring. Application performance. Why is APM so important?
A modern DEM solution provides analytics for key application performance indicators across web, mobile, and IoT channels, providing a detailed overview of user behavior. These indicators may include release success, adoption rate, and conversions (for example, in-app actions taken by a user such as a purchase, inquiry, or signup).
Split Your Media Types. So if achieving Critical CSS is proving quite tricky—and it probably is—another option we have is to split our main CSS file out into its individual Media Queries. If you’re working with a large or legacy codebase, things get even more difficult…. The practical upshot of this is that the browser will….
Although Dynatrace can’t help with the manual remediation process itself , end-to-end observability, AI-driven analytics, and key Dynatrace features proved crucial for many of our customers’ remediation efforts. Time is of the essence in any crisis—so is having the right tools and capabilities.
Which experience am I most likely to share, with friends or on social media? The only hitch was that the QR reader wasn’t working – but the agency knew that and had staffed the exit gate. What do you think my net promoter score ( NPS ) might be for each of these? BizOps maturity.
As organizations started learning about Log4Shell from news feeds, blogs, and social media, the Dynatrace security team—and Dynatrace Application Security—kicked into action. On December 9, 2021, the first indicators of the Log4j vulnerability (Log4Shell) began to reverberate across the world.
Which experience am I most likely to share, with friends or on social media? The only hitch was that the QR reader wasn’t working – but the agency knew that and had staffed the exit gate. What do you think my net promoter score ( NPS ) might be for each of these? BizOps maturity.
Aside from lost revenue, users and customers may be quick to call out your brand on social media when your offering’s availability struggles, as Instagram experienced not long ago. Dynatrace offers comprehensive digital experience monitoring and business analytics that drive to the heart of the user journey.
I tend to lean towards social media for evaluating this. The platform has rich capabilities like Digital Business Analytics , Session Replay , Real User Monitoring ,… that allow you to capture the right metrics and communicate without friction. It’s also from a brand perspective highly relevant.
By Burak Bacioglu , Meenakshi Jindal Asset Management at Netflix At Netflix, all of our digital media assets (images, videos, text, etc.) And finally, we have an Apache Iceberg layer which stores assets in a denormalized fashion to help answer heavy queries for analytics use cases. are stored in secure storage layers.
1] NIST Special Publication 800-88 Revision 1, Guidelines for Media Sanitization Keep valuable data in Grail with targeted deletion With record-level hard deletion, Dynatrace gives you control and transparency over your data. Industry standards refer to hard deletion by overwriting data as the appropriate data sanitization method. [1]
This is particularly useful for in-depth crash analytics. We can, for instance, see a thread that is processing media content and pushing data into a memory buffer. Dynatrace has the built-in capability to capture process crash logs. MediaProcessor was active putting bytes into a buffer!
If that service is slow, failing, or not available at all it results in frustration mentioned in some of the comments on social media and the app store. Dynatrace’s RUM for Mobile Apps provides crash analytics by default. We picked the Authentication Service as it’s the one first involved when a user opens the app. Mobile Crashes.
Every day we access applications to shop online, stream TV shows, connect to social media, manage finances, and work. User Experience and Business Analytics ery user journey and maximize business KPIs. APM can also be referred to as: Application performance management. Performance monitoring. Application monitoring.
The paradigm spans across methods, tools, and technologies and is usually defined in contrast to analytical reporting and predictive modeling which are more strategic (vs. Operational Reporting Pipeline Example Iceberg Sink Apache Iceberg is an open source table format for huge analytics datasets. tactical) in nature. Dehghani, Zhamak.
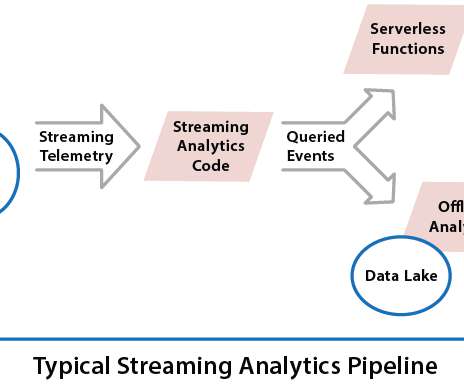
Consider the typical, conventional streaming analytics pipeline available on popular cloud platforms: A conventional pipeline combines telemetry from all data sources into a single stream which is queried by the user’s streaming analytics application. However, real-time digital twins easily bring these capabilities within reach.
Today’s cloud-native applications rely on many different microservices that perform processes like pushing event data to an analytics service, establishing database connections, sending push notifications or other messages — the list goes on.
We also work with some of Africa's fastest growing startups such as Aerobotics, Apex Innovations, Asoriba, Custos Media, EMS Invirotel, Entersekt, HealthQ, JUMO, Luno, Mukuru, PayGate, Parcel Ninja, Simfy Africa, Zapper, Zanibal, and Zoona. Using AWS, JUMO has been able to process this data more than 1 000 times faster.
Financial analysis with real-time analytics is used for predicting investments and drives the FinTech industry's needs for high-performance computing. This has given rise to a completely new set of computing workloads for Machine Learning which drives Artificial Intelligence applications.
UK companies are using AWS to innovate across diverse industries, such as energy, manufacturing, medicaments, retail, media, and financial services and the UK is home to some of the world's most forward-thinking businesses. To take advantage of the game-changing opportunities, businesses are looking to blend into the digital world.
The Netflix Media Database (NMDB) is one such example. Netflix Conductor is maintained by the Media Workflow Infrastructure team. Netflix Conductor: A microservices orchestrator In the last two years since inception, Conductor has seen wide adoption and is instrumental in running numerous core workflows at Netflix.
Page Speed Benchmarks is an interactive dashboard that lets you explore and compare web performance data for leading websites across several industries – from retail to media. Home pages of 10 leading sites in the US and the EU, in each of the following industries: Auto, Finance, Media, Retail, Tech, and Travel. (We’ll
Consider the typical, conventional streaming analytics pipeline available on popular cloud platforms: A conventional pipeline combines telemetry from all data sources into a single stream which is queried by the user’s streaming analytics application. However, real-time digital twins easily bring these capabilities within reach.
The upcoming prefers-reduced-data media query, which allows CSS to set different options depending on this setting. Weirdly, they report as a range of browsers in our analytics including the Android WebView, Chrome and Safari (despite it’s not supporting this!). The CSS media query version of Save Data mentioned above.
In my many conversations with customers, and with the media, I encountered surprise and excitement about the extent that European enterprises have already been using the Amazon Web Services for some time. Shell leverages AWS for big data analytics to help achieve these goals.
After all, when we look at our analytics, we will hardly find any customers browsing our sites or apps with a mid-range device on a flaky 3G connection. While a vast majority of the time is spent in just a few mobile apps, social media platforms provide a gateway to the web and your services — especially in education.
We organize all of the trending information in your field so you don't have to. Join 5,000+ users and stay up to date on the latest articles your peers are reading.
You know about us, now we want to get to know you!
Let's personalize your content
Let's get even more personalized
We recognize your account from another site in our network, please click 'Send Email' below to continue with verifying your account and setting a password.


Let's personalize your content