This site uses cookies to improve your experience. To help us insure we adhere to various privacy regulations, please select your country/region of residence. If you do not select a country, we will assume you are from the United States. Select your Cookie Settings or view our Privacy Policy and Terms of Use.
Cookie Settings
Cookies and similar technologies are used on this website for proper function of the website, for tracking performance analytics and for marketing purposes. We and some of our third-party providers may use cookie data for various purposes. Please review the cookie settings below and choose your preference.
Used for the proper function of the website
Used for monitoring website traffic and interactions
Cookie Settings
Cookies and similar technologies are used on this website for proper function of the website, for tracking performance analytics and for marketing purposes. We and some of our third-party providers may use cookie data for various purposes. Please review the cookie settings below and choose your preference.
Strictly Necessary: Used for the proper function of the website
Performance/Analytics: Used for monitoring website traffic and interactions
We introduced Digital Business Analytics in part one as a way for our customers to tie business metrics to application performance and user experience, delivering unified insights into how these metrics influence business milestones and KPIs. A sample Digital Business Analytics dashboard. Dynatrace news.
Today, Dynatrace is happy to announce OneAgent support for discovering and automatically capturing OpenTelemetry trace data for Java. PurePath integrates OpenTelemetry Java data for enterprise-grade collection and contextual analytics. Enriching local monitoring data with project-specific additions.
Dynatrace is fully committed to the OpenTelemetry community and to the seamless integration of OpenTelemetry data , including ingestion of custom metrics , into the Dynatrace open analytics platform. Find OpenTracing for Java seamlessly integrated into PurePath 4. Deep-code execution details.
By unifying log analytics with PurePath tracing, Dynatrace is now able to automatically connect monitored logs with PurePath distributed traces. This provides a holistic view, advanced analytics, and AI-powered answers for cloud optimization and troubleshooting. New to Dynatrace? If so, start your free trial today!
We’ve introduced brand-new analytics capabilities by building on top of existing features for messaging systems. You can configure and activate the following extensions in Dynatrace at Settings > Monitoring > Monitored technologies > Supported technologies : ActiveMQ. Apache Kafka. New to Dynatrace?
Kafka is optimized for high-throughput event streaming , excelling in real-time analytics and large-scale data ingestion. RabbitMQ can be deployed in distributed environments and includes monitoring tools through a built-in dashboard and CLI. RabbitMQ supports high message volumes but may experience performance drops under heavy loads.
Many companies rely on Citrix as a critical component of their infrastructure that demands thorough observability and integrated analytics across the entire application landscape. Automated AI-powered analytics are necessary to match the scale of monitoring these enterprises require.
Monitoring SAP products can present challenges Monitoring SAP systems can be challenging due to the inherent complexity of using different technologies—such as ABAP, Java, and cloud offerings—and the sheer amount of generated data. SAP HANA server infrastructure monitored with OneAgent.
Recently, a critical vulnerability was discovered in Apache Struts, a widely used Java-based web application framework. The Apache Struts CVE-2024-53677 vulnerability Apache Struts is a popular open-source framework for dynamic web applications with Java. Whats next?
The insights provided by this feature help teams to prioritize CVEs based on their reachability through monitoring the vulnerable functions. Vulnerable function monitoring Tracking vulnerable open source software components efficiently is one of the most important pillars of managing attack surfaces.
Performance improvements ensure full observability without jeopardizing user experience: We’re seeing tremendous performance improvements, especially for functions that are written in Java. For details on monitoring such containers, see Deploy OneAgent to container-image packaged functions in Dynatrace Documentation.
We’ve worked closely with our partner AWS to deliver a complete, end-to-end picture of your cloud environment that includes monitoring support for all AWS services. Dynatrace can monitor AWS Lambda functions automatically, just like any other service. With these steps complete, your Lambda functions are now fully monitored.
These traditional approaches to log monitoring and log analytics thwart IT teams’ goal to address infrastructure performance problems, security threats, and user experience issues. Further, these resources support countless Kubernetes clusters and Java-based architectures. where an error occurred at the code level.
already address SNMP, WMI, SQL databases, and Prometheus technologies, serving the monitoring needs of hundreds of Dynatrace customers. JMX monitoring extensions are currently being migrated. Extensions can monitor virtually any type of technology in your environment. and focusing on a much-improved version 2.0 Extensions 2.0
As an example, many retailers already leverage containerized workloads in-store to enhance customer experiences using video analytics or streamline inventory management using RFID tracking for improved security. Application observability also helps to improve end-user experiences when combined with Dynatrace Digital Experience monitoring.
Data analysis within large and highly dynamic microservices environments is the biggest challenge that Application Performance Monitoring (APM) vendors face today. Dynatrace provides the widest monitoring coverage of software frameworks that are used in modern enterprise applications. Why are we doing this?
Gartner has estimated that 70% of new cloud-native application monitoring will use open source instrumentation by 2025. The arrival of the OpenTelemetry initiative is timely, as development teams are increasingly becoming active in monitoring and observability efforts to accelerate release times and simplify management.
The company receives tens of thousands of requests per second on its edge layer and sees hundreds of millions of events per hour on its analytics layer. “For example, if most teams run Java, it might not make sense trying to support an outlier. Platform engineering looks to bring in a unified toolset.”
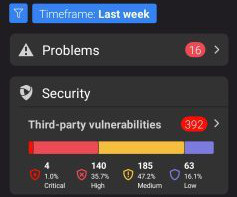
Dynatrace Application Security changed this by introducing Runtime Vulnerability Analytics for your production environments. The new version of the Dynatrace mobile app extends this visibility further to real-life vulnerability monitoring, providing quick and easy access to security insights directly on your mobile device.
Data quality and drift: Monitoring the quality and characteristics of training and runtime data to detect significant changes that might impact model accuracy. Utilizing an additional OpenTelemetry SDK layer, this data seamlessly flows into the Dynatrace environment, offering advanced analytics and a holistic view of the AI deployment stack.
Instrumentation enables the shipment of a monitoring library with your app that collects telemetry data and sends it back to the Dynatrace platform for analysis. Another nifty Session Replay feature is the ability to capture custom events—events that are not typically captured by default—irrespective of whether the codebase is Java or Kotlin.
Statistical analysis and mining of huge multi-terabyte data sets is a common task nowadays, especially in the areas like web analytics and Internet advertising. This approach often leads to heavyweight high-latency analytical processes and poor applicability to realtime use cases. Case Study. Case Study. Clifford, I.
I have been using it at my current tour through different conferences ( Devoxx , Confitura ) and meetups, ( Cloud Native , KraQA , Trojmiasto Java UG ) where I’ve promoted keptn. In my case, both prometheus.knative-monitoring pods jumped in Process CPU and I/O request bytes. Automated Container Log Access.
Unlike other solutions, Dynatrace Application Security is part of the larger Dynatrace Software Intelligence Platform , which provides application and microservices monitoring, infrastructure monitoring, digital experience management, business analytics, and cloud automation. Automatic PHP application security with Dynatrace.
3-minutes later, he had the OneAgent installed pointing it to the “End-User-PC” host group that Chad has been using to organize monitoring data for those end-user machines that are now actively monitored with Dynatrace. Chris was positively surprised that this was all it takes to get full stack monitoring.
Infrastructure Monitoring. Settings > Maintenance windows > Monitoring, alerting and availability. New analytics view for message queues. To see all queues and topics detected by OneAgent within your monitoring environment. Infrastructure Monitoring. Log Monitoring. Synthetic monitoring.
Such additional telemetry data includes user-behavior analytics, code-level visibility, and metadata (including open-source data). Such monitoring data is critical to providing satisfying digital experiences and services to customers. Unlock extended end-to-end traceability for OpenTelemetry-instrumented Go applications.
Unlike traditional monitoring, which focuses on watching individual metrics for system health indicators with no overall context, observability goes deeper , analyzing telemetry data for a comprehensive view of the system’s internal state in context of the wider system. There are three main types of telemetry data: Metrics.
As a result, developers and operations teams can automatically manage, monitor, and provision IT resources through software code rather than manually configure one device after another. Log4Shell enables an attacker to use remote code execution to engage with software that uses the Java logging library Log4j versions 2.0 and 2.14.1.
Enterprise data stores grow with the promise of analytics and the use of data to enable behavioral security solutions, cognitive analytics, and monitoring and supervision. Consider Log4Shell, a software vulnerability in Apache Log4j 2 , a popular Java library.
The next level of observability: OneAgent In the first two parts of our series, we used OpenTelemetry to manually instrument our application and send the telemetry data straight to the Dynatrace analytics back end. OneAgent is the native telemetry data collector and monitoring solution of Dynatrace.
Luckily, Dynatrace provides in-depth memory allocation monitoring, which allows fine-grained allocation analysis and can even point to the root cause of a problem. At Dynatrace, we use dashboards to get a quick overview of the status of monitored services. While the amount of bytes allocated for the Java API is typically 1.5X
In 2015, the Spring folks already regarded Dynatrace as the gold standard for performance monitoring. OneAgent also provides Spring Micrometer metrics with best-in-class distributed tracing, plus memory and garbage collector analysis for Spring Java applications and microservices.
The proof point for one organization is Log4Shell, a critical zero-day vulnerability discovered in a popular Java library in 2021. After getting the right observability and analytics platform in place, the primary key to success is enabling teams to access it en masse. Don’t let perfect get in the way of good.
A dashboard for monitoring activities such as database locks, connected sessions, and prepared transactions for multiple servers. It is known for its flexibility and large feature set, as well as supporting databases utilizing a Java Database Connectivity (JDBC) driver, rendering it a default tool for both DBAs and developers.
Our tactical approach was to use Netflix-specific libraries for collecting traces from Java-based streaming services until open source tracer libraries matured. We chose Open-Zipkin because it had better integrations with our Spring Boot based Java runtime environment.
The supported programming languages for PostgreSQL include.Net, C, C++, Delphi, Java, JavaScript (Node.js), Perl, PHP, Python and Tcl, but PostgreSQL can support many server-side procedural languages through its available extensions. We found that Java is the most popular programming language for PostgreSQL, being leveraged by 31.1%
With Dynatrace monitoring all your environments from pre-production to production, full visibility into hybrid enterprise cloud, Kubernetes, and every container and workload comes with zero configuration. Dynatrace Application Security currently detects, assesses, and manages Java vulnerabilities. Next up: node.js.
Log4Shell is a software vulnerability in Apache Log4j 2 , a popular Java library for logging information in applications. We used Dynatrace capabilities to set up Log4Shell-specific attack monitoring and incident detection. Incident detection and response.
For example, the open source Java library at the heart of the Log4Shell crisis in 2021 was patched within days given the pervasiveness of the code. Observability is critical for monitoring application performance, infrastructure, and user behavior within hybrid, microservices-based environments.
The paradigm spans across methods, tools, and technologies and is usually defined in contrast to analytical reporting and predictive modeling which are more strategic (vs. CDC events can also be sent to Data Mesh via a Java Client Producer Library. Trackers are now easy for the team to create, review, change, monitor and discover.
Join Etleap , an Amazon Redshift ETL tool to learn the latest trends in designing a modern analytics infrastructure. Learn what has changed in the analytics landscape and how to avoid the major pitfalls which can hinder your organization from growth. Client libraries are available for Node, Ruby, Python, PHP, Go, Java and.NET.
Join Etleap , an Amazon Redshift ETL tool to learn the latest trends in designing a modern analytics infrastructure. Learn what has changed in the analytics landscape and how to avoid the major pitfalls which can hinder your organization from growth. Client libraries are available for Node, Ruby, Python, PHP, Go, Java and.NET.
Production Use Cases Real-Time APIs (backed by the Cassandra database) for asset metadata access don’t fit analytics use cases by data science or machine learning teams. For fast processing of the events, we use different settings of Kafka consumer and Java executor thread pool.
We organize all of the trending information in your field so you don't have to. Join 5,000+ users and stay up to date on the latest articles your peers are reading.
You know about us, now we want to get to know you!
Let's personalize your content
Let's get even more personalized
We recognize your account from another site in our network, please click 'Send Email' below to continue with verifying your account and setting a password.


Let's personalize your content