This site uses cookies to improve your experience. To help us insure we adhere to various privacy regulations, please select your country/region of residence. If you do not select a country, we will assume you are from the United States. Select your Cookie Settings or view our Privacy Policy and Terms of Use.
Cookie Settings
Cookies and similar technologies are used on this website for proper function of the website, for tracking performance analytics and for marketing purposes. We and some of our third-party providers may use cookie data for various purposes. Please review the cookie settings below and choose your preference.
Used for the proper function of the website
Used for monitoring website traffic and interactions
Cookie Settings
Cookies and similar technologies are used on this website for proper function of the website, for tracking performance analytics and for marketing purposes. We and some of our third-party providers may use cookie data for various purposes. Please review the cookie settings below and choose your preference.
Strictly Necessary: Used for the proper function of the website
Performance/Analytics: Used for monitoring website traffic and interactions
As a result, organizations are implementing security analytics to manage risk and improve DevSecOps efficiency. Fortunately, CISOs can use security analytics to improve visibility of complex environments and enable proactive protection. What is security analytics? Why is security analytics important? Here’s how.
Log monitoring, log analysis, and log analytics are more important than ever as organizations adopt more cloud-native technologies, containers, and microservices-based architectures. Logs can include data about user inputs, system processes, and hardware states. What is log analytics? Log monitoring vs log analytics.
With 99% of organizations using multicloud environments , effectively monitoring cloud operations with AI-driven analytics and automation is critical. IT operations analytics (ITOA) with artificial intelligence (AI) capabilities supports faster cloud deployment of digital products and services and trusted business insights.
Real-time flight data monitoring setup using ADS-B (using OpenTelemetry) and Dynatrace The hardware We’ll delve into collecting ADS-B data with a Raspberry Pi, equipped with a software-defined radio receiver ( SDR ) acting as our IoT device, which is a RTL2832/R820T2 based dongle , running an ADS-B decoder software ( dump1090 ).
IBN is a natural progression of SDN that combines intelligence, analytics, machine learning , and orchestration to automate network management. IBN abstracts the complex part of underlying hardware, and network configuration to allow users to express their desired intent in natural language.
Greenplum Database is an open-source , hardware-agnostic MPP database for analytics, based on PostgreSQL and developed by Pivotal who was later acquired by VMware. This feature-packed database provides powerful and rapid analytics on data that scales up to petabyte volumes. What Exactly is Greenplum? At a glance – TLDR.
Kafka is optimized for high-throughput event streaming , excelling in real-time analytics and large-scale data ingestion. Its architecture supports stream transformations, joins, and filtering, making it a powerful tool for real-time analytics. Apache Kafka, designed for distributed event streaming, maintains low latency at scale.
It enables multiple operating systems to run simultaneously on the same physical hardware and integrates closely with Windows-hosted services. Therefore, they experience how the application code functions and how the application operations depend on the underlying hardware resources and the operating system managed by Hyper-V.
By leveraging Dynatrace observability on Red Hat OpenShift running on Linux, you can accelerate modernization to hybrid cloud and increase operational efficiencies with greater visibility across the full stack from hardware through application processes.
Many of these innovations will have a significant analytics component or may even be completely driven by it. For example many of the Internet of Things innovations that we have seen come to life in the past years on AWS all have a significant analytics components to it. Cloud analytics are everywhere.
Besides the traditional system hardware, storage, routers, and software, ITOps also includes virtual components of the network and cloud infrastructure. Although modern cloud systems simplify tasks, such as deploying apps and provisioning new hardware and servers, hybrid cloud and multicloud environments are often complex.
To cope with the risk of cyberattacks, companies should implement robust security measures combining proactive preventive measures such as runtime vulnerability analytics , with comprehensive application and perimeter protection through firewalls, intrusion detection systems, and regular security audits.
This is a republish of a blog on VentureBeat by Wei Li, Intel VP/GM, AI and Analytics (AIA). What’s more is that this AI performance boost driven by software optimizations is free, requiring almost no code changes or developer time and no additional hardware costs.
Such applications track the inventory of our network gear: what devices, of which models, with which hardware components, located in which sites. CORE The CORE team uses Python in our alerting and statistical analytical work. The network devices that underlie a large portion of the CDN are mostly managed by Python applications.
With Azure Functions, engineers don’t have to worry about provisioning and maintaining underlying hardware; they simply upload their code, and it’s up and running seconds later. Simplify error analytics. These functions are usually triggered by events, therefore, Microsoft Azure is also commonly described as “event-driven FaaS.”
Container technology is very powerful as small teams can develop and package their application on laptops and then deploy it anywhere into staging or production environments without having to worry about dependencies, configurations, OS, hardware, and so on. The time and effort saved with testing and deployment are a game-changer for DevOps.
In these modern environments, every hardware, software, and cloud infrastructure component and every container, open-source tool, and microservice generates records of every activity. Observability relies on telemetry derived from instrumentation that comes from the endpoints and services in your multi-cloud computing environments.
IaC, or software intelligence as code , codifies and manages IT infrastructure in software, rather than in hardware. These DevSecOps trends will also aid teams as they integrate security and compliance into processes without slowing innovation or creating additional work for already time-strapped teams.
With Azure Functions, engineers don’t have to worry about provisioning and maintaining underlying hardware; they simply upload their code, and it’s up and running seconds later. Simplify error analytics. These functions are usually triggered by events, therefore, Microsoft Azure is also commonly described as “event-driven FaaS.”
Once in production, our site will likely look very different to how it did in our development environment: tag managers have kicked in, your ads are on the site, your analytics package is capturing data, and all third parties are implemented and running. How: RUM tooling, analytics, monitoring. When: Constantly in live environments.
Traditionally, teams achieve this high level of uptime using a combination of high-capacity hardware, system redundancy, and failover models. With monitoring data consolidated into a single AI-enabled analytics platform, teams can automate operations and incident response. Automate IT operations.
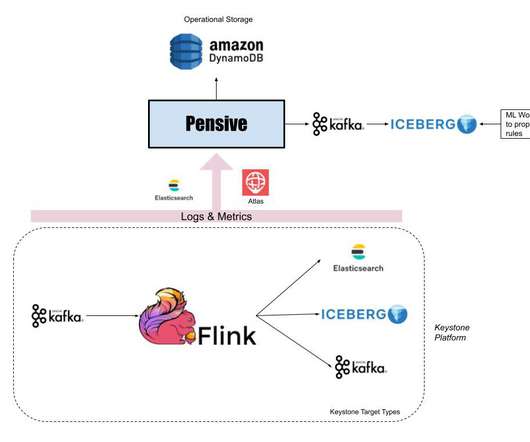
Detection of Platform-wide Issues Pensive does error classification on individual workflow step failures, but by doing real-time analytics on the errors detected by Pensive using Apache Kafka and Apache Druid, we can quickly identify platform issues affecting many workflows. In the future, we are looking to automate this process.
By leveraging the Dynatrace Operator and Dynatrace capabilities on Red Hat OpenShift on IBM Power, customers can accelerate their modernization to hybrid cloud and increase operational efficiencies with greater visibility across the full stack from hardware through application processes.
Dynatrace’s RUM for Mobile Apps provides crash analytics by default. Because Synthetic tests are predictable and eliminate any seasonal behavior or impact of the end user’s environment (defect hardware, bad Wi-Fi, etc.). Mobile Crashes. For our SLO the only thing we need is the default Mobile Crash Rate metric.
And even Digital business analytics. You can’t keep pace by simply upgrading to the latest hardware and updating to the latest software releases twice a year. AIOps for automating the identification and resolution of problems.
If your application runs on servers you manage, either on-premises or on a private cloud, you’re responsible for securing the application as well as the operating system, network infrastructure, and physical hardware. What are some key characteristics of securing cloud applications?
And there’s so much more: Infrastructure monitoring with integrations to all leading cloud providers, AIOps to automate the identification and resolution of problems, Digital Experience Management ( Synthetic Monitoring , Real User Monitoring including Session Replay ), And even Digital business analytics.
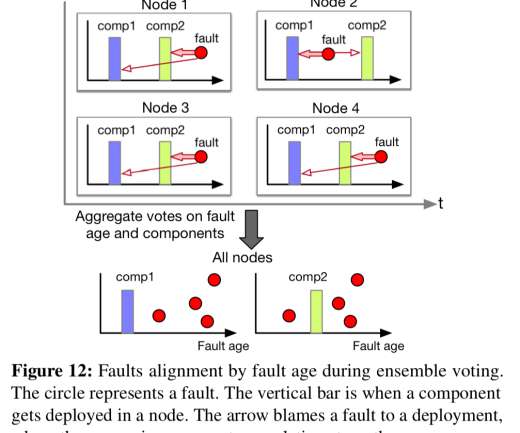
Gandalf: an intelligent, end-to-end analytics service for safe deployment in cloud-scale infrastructure , Li et al., memory leaks that take hours to build up into an issue); and there can be problems that only exhibit themselves with certain user, hardware, or software configurations. NSDI’20.
Key Takeaways Distributed storage systems benefit organizations by enhancing data availability, fault tolerance, and system scalability, leading to cost savings from reduced hardware needs, energy consumption, and personnel. These distributed storage services also play a pivotal role in big data and analytics operations.
On-premise BI tools also require companies to provision and maintain complex hardware infrastructure and invest in expensive software licenses, maintenance fees, and support fees that cost upwards of thousands of dollars per user per year. We believe this provides a simple way for users to deriving valuable insights without too much work.
ScaleGrid’s comprehensive solutions provide automated efficiency and cost reduction while offering tailored features such as predictive analytics for businesses of all sizes. This includes being able to select the right hardware options for the job, enforcing desired safety measures, and having access to a variety of database software.
Introduction of clustered collections for optimized analytical queries. You should also review your hardware resources, how you use MongoDB, and any custom configurations. Each version offers new features that can make for a better database experience; let’s look at just a few of them: In MongoDB 5.x: In MongoDB 6.x:
Number of slow queries recorded Select types, sorts, locks, and total questions against a database Command counters and handlers used by queries give an overall traffic summary Along with this, PMM also comes with Query Analytics giving much detailed information about queries getting executed.
Understanding Power BI Definition and Purpose Power BI is a business analytics service that can gather all your data in a single platform and enable users to analyze and visualize easily. In this article, we will explore the process of how to connect MySQL to Power BI, a leading business intelligence tool.
They may even help develop personalized web analytics software as well as leverage Hashes, Bitmaps, or Streams from Redis Data Types into a wider scope of applications such as analytic operations. Taking protective measures like these now could protect both your data and hardware from future harm down the line.
There are many more opportunities to customize your infrastructure with an on-premise setup, but requires a significant upfront investment in hardware and software computing resources, as well as on-going maintenance responsibilities.
Shell leverages AWS for big data analytics to help achieve these goals. When Tom Tom launched the LBS platform they wanted the ability to reach millions of developers all around the world without having them invest a lot of capital upfront in hardware and building expensive data centers so turned to the cloud.
They may even help develop personalized web analytics software as well as leverage Hashes, Bitmaps, or Streams from Redis Data Types into a wider scope of applications such as analytic operations. Taking protective measures like these now could protect both your data and hardware from future harm down the line.
Hardware Compatibility Testing: In this scenario, an application is tested against various hardware configurations to check behavior. As well as consulting the requirements, Google Analytics is the most comprehensive way to obtain information about the most widely used browsers along with a list of their versions and operating systems.
The early GPU systems were very vendor specific and mostly consisted of graphic operators implemented in hardware being able to operate on data streams in parallel. Programming the GPU evolved in a similar fashion; it started with the early APIs being mainly pass-through to the operations programmed in hardware.
Our audience is particularly strong in the software (20% of respondents), computer hardware (4%), and computer security (2%) industries—over 25% of the total. We also asked respondents what tools they used for statistics and machine learning and what platforms they used for data analytics and data management.
In traditional database architectures, database engines often run a small search engine or data warehouse engines on the same hardware as the database. Also, you can choose to program post-commit actions, such as running aggregate analytical functions or updating other dependent tables.
Additionally, many high-end HPC applications take advantage of knowing their in-house hardware platforms to achieve major speedup by exploiting the specific processor architecture. There is no more need for hardware tinkering to keep the clusters up and running (I spent many nights doing this; there is no glory in it). until today.
Software and hardware components are autonomous and execute tasks concurrently. A distributed system comprises of a variety of hardware and software components with different operating systems and technologies, meaning the processors are separate and independent of each other. State is distributed through the system. Concurrency.
We organize all of the trending information in your field so you don't have to. Join 5,000+ users and stay up to date on the latest articles your peers are reading.
You know about us, now we want to get to know you!
Let's personalize your content
Let's get even more personalized
We recognize your account from another site in our network, please click 'Send Email' below to continue with verifying your account and setting a password.


Let's personalize your content