This site uses cookies to improve your experience. To help us insure we adhere to various privacy regulations, please select your country/region of residence. If you do not select a country, we will assume you are from the United States. Select your Cookie Settings or view our Privacy Policy and Terms of Use.
Cookie Settings
Cookies and similar technologies are used on this website for proper function of the website, for tracking performance analytics and for marketing purposes. We and some of our third-party providers may use cookie data for various purposes. Please review the cookie settings below and choose your preference.
Used for the proper function of the website
Used for monitoring website traffic and interactions
Cookie Settings
Cookies and similar technologies are used on this website for proper function of the website, for tracking performance analytics and for marketing purposes. We and some of our third-party providers may use cookie data for various purposes. Please review the cookie settings below and choose your preference.
Strictly Necessary: Used for the proper function of the website
Performance/Analytics: Used for monitoring website traffic and interactions
As user experiences become increasingly important to bottom-line growth, organizations are turning to behavior analytics tools to understand the user experience across their digital properties. Here’s what these analytics are, how they work, and the benefits your organization can realize from using them.
Today, Dynatrace is announcing that it has successfully achieved Google Cloud Ready – AlloyDB designation in support of an extended integration to Google Cloud’s AlloyDB for PostgreSQL. Google Cloud Ready – AlloyDB is a new designation for the solutions of Google Cloud’s technology partners that integrate with AlloyDB.
Kris Saling – Chief Analytics Officer for the Army Talent Management Task Force and Director of People Analytics in the Office of the Assistant Secretary of the Army (Manpower & Reserve Affairs). Listen and subscribe on the Tech Transforms website or your favorite podcast platform. Google Podcasts.
How To Monitor And Optimize Google Core Web Vitals How To Monitor And Optimize Google Core Web Vitals Matt Zeunert 2024-04-16T10:00:00+00:00 2024-04-16T12:05:36+00:00 This article is sponsored by DebugBear Google’s Core Web Vitals initiative has increased the attention website owners need to pay to user experience.
Improving The Performance Of Wix Websites (Case Study). Improving The Performance Of Wix Websites (Case Study). Since implementing these changes, we have seen a dramatic improvement in the performance of websites built and hosted on our platform. Dan Shappir. 2021-11-22T10:30:00+00:00. 2021-11-22T11:06:56+00:00. Large preview ).
User experience now defines website success. Metrics that offer measurable, repeatable insight into the user experience from the moment they arrive on a website from a mobile or desktop device. Great user experiences start with Core Web Vitals (CWVs) — a set of metrics defined by Google to help measure user experience at scale.
Dynatrace, operated from Tokyo, addresses the data residency needs of the Japanese market Dynatrace operates its AI-powered unified platform for observability, security, and business analytics as a SaaS solution in 19 worldwide regions on three hyperscalers (AWS, Azure, and GCP). Data residency in Japan is a must.
He also suggested ways to capitalize on data analytics to better prepare our nation for times of need. Listen and subscribe on our website , or your favorite podcast platform, and leave us a review ! I understand, and I lived with the problem.” Dive into the full episode to hear his insights.
Signals For Customizing Website User Experience. Signals For Customizing Website User Experience. In this article, I want to spend a bit more time on this, and also look at other signals we can similarly use to help us make decisions on what to load on our websites. Barry Pollard. 2022-03-07T10:30:00+00:00. save the user’s data!
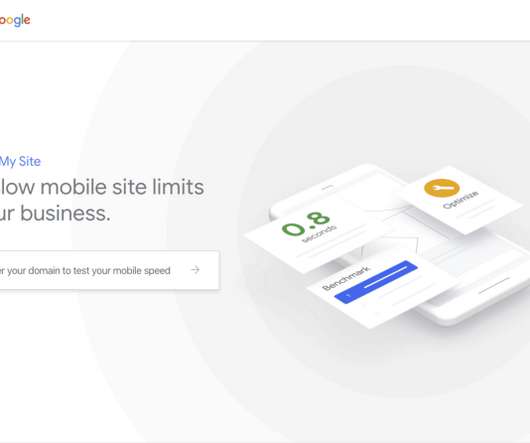
Previous results from other companies or websites, like those published on WPO Stats , are essential to start a conversation about the topic, but it’s not sufficient. Using Test My Site from Think with Google : Gives you an estimation of potential revenue increase for your site when saving loading time. I would repeat over and over.
Additionally, as the program gathers more data, it will enable predictive analytics to forecast future talent and skill deficits. Listen and subscribe on our website , or your favorite podcast platform, and leave us a review !
Running speed tests with tools like Google PageSpeed Insights , WebPageTest , or KeyCDN’s Website Speed Test are always a good way to help gauge your website’s performance. With that being said, see how we easily achieved a 100/100 score with WordPress and Google PageSpeed Insights. Why Care About Page Speed?
Don’t Sink Your Website With Third Parties. Don’t Sink Your Website With Third Parties. You’ve spent months putting together a great website design, crowd-pleasing content, and a business plan to bring it all together. Your website may be using more third-party services than you realize. Ken Harker.
Are Imposter Domains Re-Publishing Your Website? Are Imposter Domains Re-Publishing Your Website? We explore how you can use web analytics or real user measurement data on your website to get insight into any imposter domains re-publishing your work. Ken Harker. 2021-09-20T11:30:00+00:00. 2021-09-20T14:12:33+00:00.
How Partytown Eliminates Website Bloat From Third-Party Apps. How Partytown Eliminates Website Bloat From Third-Party Apps. However, it’s not always easy to maintain high performance in websites. Even if your website is designed with usability in mind, these factors impede users from fully benefiting from the website’s features.
A digital touchpoint may be a mobile application, a website, a SmartTV app, an ATM, an airport check-in kiosk or similar. You have to be aware that at any of your digital touchpoints, the digital experience is measured against the best-in-class available coming from Google, Facebook and other digital leaders. Dynatrace news.
Session replay is an IT technology that creates anonymized video-like recordings of actions taken by users interacting with your website or mobile application. Replay software also captures web assets such as CSS so it can create accurate recordings even if your website changes. Improved analytic context. What is session replay?
The Speed Report in the Google Search Console (recently renamed “Core Web Vitals”) is offering two new performance metrics: Cumulative Layout Shift and Largest Contentful Paint additionally to the First Input Delay. Core Web Vitals have also been deployed in tools such as Page Speed Insights or Lighthouse.
Organizations are constantly being measured against the best available digital experiences — coming from Google, Amazon, Facebook, and other industry leaders. A digital touchpoint may be a mobile application, a website, a smart TV, ATM, airport check-in kiosk, point-of-sale terminal, and so on. User experience score.
The most beautiful, spectacular site in the world won’t do anyone much good if people can’t find it on Google (or Bing, or DuckDuckGo). Following best practice usually means a better website, more organic traffic, and happier visitors. What is your website already ranking well for and why? Google Keyword Planner.
that will help you master website monitoring, analytics, and diagnostics. According to Google, a 'good' INP time is faster that 200 milliseconds. Learn how to identify and debug slow interactions – and most important, how to make them faster, improve your INP time, and potentially improve your Google search rank!
LCP, or Largest Contentful Paint , is one of the three Core Web Vitals that you must “pass” to get the full search ranking boost from Google as part of their Page Experience Update. From an SEO perspective, it doesn’t really matter what other tools tell you, GSC is what Google Search sees. The issue was that LCP was too slow on mobile.
Google has announced that from 1st May, they will start to consider “Page Experience” as part of Search ranking , as measured by a set of metrics called Core Web Vitals. even the Google tools like PageSpeed Insights and the Core Web Vitals report in Google Search Console seem to give confusing information. Barry Pollard.
Previous results from other companies or websites, like those published on WPO Stats , are essential to start a conversation about the topic, but it’s not sufficient. Using Test My Site from Think with Google : Gives you an estimation of potential revenue increase for your site when saving loading time. I would repeat over and over.
Google PageSpeed Insights has a their “Speed Score.” Who is your website’s users – Google, or your real customers? Many people assume that Google takes the score from their Insights into account, but that’s simply untrue. Yes, Google is marking us down for using their own analytics tools.
We’re happy to announce that Dynatrace now provides guidance and templates for setting up Service-Level Objectives (SLOs) with the right metrics, gives you all the facts, and combines this with the powerful analytics of problem root-cause detection. Read more: Google’s definition of the term Site Reliability Engineering.
In the latter camp, you’re quite often dealing with data, marketing, and insights teams: a lot of the third parties that websites employ are likely non-user facing, and typically, although not always, exist only to serve the business (analytics, AB testing, retargeting, tracking, etc.). Using the Google Sheet. is: Open it up.
This requires your website or application to be heavily optimized for mobile. After all, when we look at our analytics, we will hardly find any customers browsing our sites or apps with a mid-range device on a flaky 3G connection. One of the famous examples is Flipkart , India’s largest e-commerce website. Large preview ).
Why do we need Lighthouse at all when Google also offers similar reports in PageSpeed Insights (PSI)? CrUX data is important because it is how web core vitals are measured, which, in turn, are a ranking factor for Google’s search results. Still, there’s nothing in there to tell us about the data Lighthouse is using to evaluate metrics.
The Web Performance Guide is – as its name suggests – a collection of articles we've been writing over the years to answer the most common questions we field about performance topics like site speed, why it matters, how it's measured, website monitoring tools, metrics, analytics, and optimization techniques.
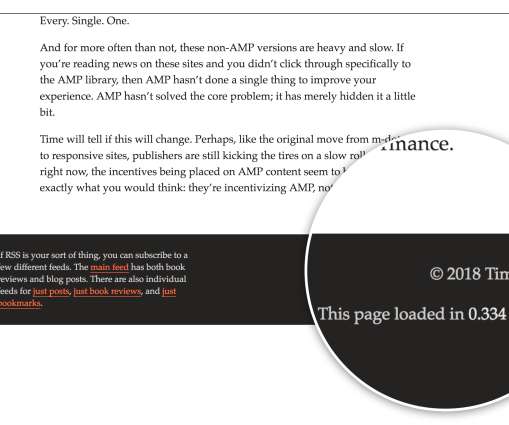
I was browsing Tim Kadlec’s website and I noticed he had added page load time metrics in the footer. Slide from Web Performance: Leveraging the Metrics that Most Affect User Experience from Google I/O ‘17 showing different key moments during a page load. Tim Kadlec’s site shows how long the page took to load in the footer.
Developing a WordPress website is not enough, you should be able to reap all the benefits of having a powerful WordPress website. Most businesses fail to get such benefits as they are passive and don’t take additional steps to grow their businesses with WordPress websites. What is WordPress?
In the second stage, I weighed edX’s website against the 10 usability heuristics identified by Jacob Nielsen. For this, you can use such well-known tools as Semrush and SimilarWeb and reviews from Trustpilot , Google Play , and Apple’s App Store. SimilarWeb analytics for the edX platform ( Large preview ). Take SimilarWeb.
As a website owner, you have a degree of control over who you use as your authoritative provider. Generally speaking, you’d only want to preconnect any origins that are important to the page (Google Fonts, yes; GoogleAnalytics, no) and things that aren’t referenced early in the already.
Website performance & speed plays a major role in the success of an online business. With the latest introduction of the Core Web Vital section on GSC + upcoming Google’s core web vital update, site owners are forced to take note of their website speed and web vitals. Daniel An, Google, 2017.
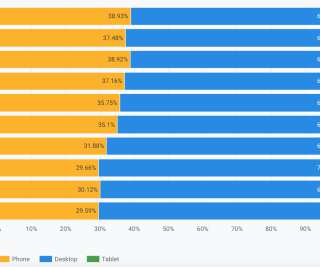
Using a page speed optimization audit tool like GTmetrix or WebPageTest is a great first step towards assessing how your website loads for visitors. However, you may be making one of the common page speed testing mistakes that often cost website owners engagement, and ultimately, revenue. Mistake #1: Only Testing Desktop.
” What that means is that every resource on a given website should have a single URL (Uniform Resource Locator) rather than multiple URLs hosting identical content. When websites have more than one URL, they rank lower in search engines and their content may not be as accessible or as popular as it otherwise could be.
I was working on an application that opened the provided webpage and then give the user an option to modify elements, add events, add analytics, and so on. I tried with loads of websites to see how they behave in iframe. Now the Selenium WebDriver is being used as it provides support for the mobile experience and dynamic websites.
I was browsing Tim Kadlec’s website and I noticed he had added page load time metrics in the footer. Slide from Web Performance: Leveraging the Metrics that Most Affect User Experience from Google I/O ‘17 showing different key moments during a page load. Tim Kadlec’s site shows how long the page took to load in the footer.
If you are working with an e-commerce website, 5 to 10 e-commerce conversion pixels are quite common these days. Ad conversion pixels, affiliate conversion pixels, web analytics conversion pixels are most common type of tags typically deployed on an e-commerce website.
Web performance metrics track the efficiency (or lack thereof) of any individual aspect of your website’s performance. The first step in improving your website is measuring it. Once you have started collecting some of these must-track web performance metrics for your website, inefficiencies will become clearer.
Google's Search App and Facebook's various apps for Android undermine these choices in slightly different ways. [3] Developers also suffer higher costs and reduced opportunities to escape Google, Facebook, and Apple's walled gardens. Et Tu, Google? #. For a browser to serve as the user's agent, it must also receive navigations.
There are a plethora of browsers available in the market for both web browsing and mobile browsing such as Internet Explorer, Google Chrome, Mozilla Firefox, Safari, Opera, etc. A website may look and function differently on different browsers which can result in a loss in revenue. We will start from the very basic. . Prerequisites.
I wanted to simulate a slow connection like those experienced by users in Uzbekistan, to see what kind of experience websites would give me. I installed ModHeader and set the ‘Save-Data’ header to let websites know I want to minimise my data usage. Google Homepage — DOM. Google Dev Docs. Large preview ).
We organize all of the trending information in your field so you don't have to. Join 5,000+ users and stay up to date on the latest articles your peers are reading.
You know about us, now we want to get to know you!
Let's personalize your content
Let's get even more personalized
We recognize your account from another site in our network, please click 'Send Email' below to continue with verifying your account and setting a password.


Let's personalize your content