This site uses cookies to improve your experience. To help us insure we adhere to various privacy regulations, please select your country/region of residence. If you do not select a country, we will assume you are from the United States. Select your Cookie Settings or view our Privacy Policy and Terms of Use.
Cookie Settings
Cookies and similar technologies are used on this website for proper function of the website, for tracking performance analytics and for marketing purposes. We and some of our third-party providers may use cookie data for various purposes. Please review the cookie settings below and choose your preference.
Used for the proper function of the website
Used for monitoring website traffic and interactions
Cookie Settings
Cookies and similar technologies are used on this website for proper function of the website, for tracking performance analytics and for marketing purposes. We and some of our third-party providers may use cookie data for various purposes. Please review the cookie settings below and choose your preference.
Strictly Necessary: Used for the proper function of the website
Performance/Analytics: Used for monitoring website traffic and interactions
As a result, organizations are implementing security analytics to manage risk and improve DevSecOps efficiency. Fortunately, CISOs can use security analytics to improve visibility of complex environments and enable proactive protection. What is security analytics? Why is security analytics important?
Log monitoring, log analysis, and log analytics are more important than ever as organizations adopt more cloud-native technologies, containers, and microservices-based architectures. Logs can include data about user inputs, system processes, and hardware states. What is log analytics? Log monitoring vs log analytics.
It enables multiple operating systems to run simultaneously on the same physical hardware and integrates closely with Windows-hosted services. This leads to a more efficient and streamlined experience for users. Microsoft Hyper-V is a virtualization platform that manages virtual machines (VMs) on Windows-based systems.
With 99% of organizations using multicloud environments , effectively monitoring cloud operations with AI-driven analytics and automation is critical. IT operations analytics (ITOA) with artificial intelligence (AI) capabilities supports faster cloud deployment of digital products and services and trusted business insights.
In today’s data-driven world, businesses across various industry verticals increasingly leverage the Internet of Things (IoT) to drive efficiency and innovation. Mining and public transportation organizations commonly rely on IoT to monitor vehicle status and performance and ensure fuel efficiency and operational safety.
Kafka is optimized for high-throughput event streaming , excelling in real-time analytics and large-scale data ingestion. Kafka scales efficiently for large data workloads, while RabbitMQ provides strong message durability and precise control over message delivery. What is RabbitMQ?
Greenplum Database is an open-source , hardware-agnostic MPP database for analytics, based on PostgreSQL and developed by Pivotal who was later acquired by VMware. This feature-packed database provides powerful and rapid analytics on data that scales up to petabyte volumes. What Exactly is Greenplum? At a glance – TLDR.
By leveraging Dynatrace observability on Red Hat OpenShift running on Linux, you can accelerate modernization to hybrid cloud and increase operational efficiencies with greater visibility across the full stack from hardware through application processes.
The app automatically builds baselines, important reference points for analyzing the environmental impact of individual hardware or software instances. Some use cases benefit from dashboards or ad-hoc analytics, complementing the insights from Carbon Impact. In other words, APM best practices are close to Green Coding best practices.
To cope with the risk of cyberattacks, companies should implement robust security measures combining proactive preventive measures such as runtime vulnerability analytics , with comprehensive application and perimeter protection through firewalls, intrusion detection systems, and regular security audits.
Besides the traditional system hardware, storage, routers, and software, ITOps also includes virtual components of the network and cloud infrastructure. Although modern cloud systems simplify tasks, such as deploying apps and provisioning new hardware and servers, hybrid cloud and multicloud environments are often complex.
IaC, or software intelligence as code , codifies and manages IT infrastructure in software, rather than in hardware. According to a Gartner report, “By 2023, 60% of organizations will use infrastructure automation tools as part of their DevOps toolchains, improving application deployment efficiency by 25%.”.
Many of these innovations will have a significant analytics component or may even be completely driven by it. For example many of the Internet of Things innovations that we have seen come to life in the past years on AWS all have a significant analytics components to it. Cloud analytics are everywhere.
In these modern environments, every hardware, software, and cloud infrastructure component and every container, open-source tool, and microservice generates records of every activity. An advanced observability solution can also be used to automate more processes, increasing efficiency and innovation among Ops and Apps teams.
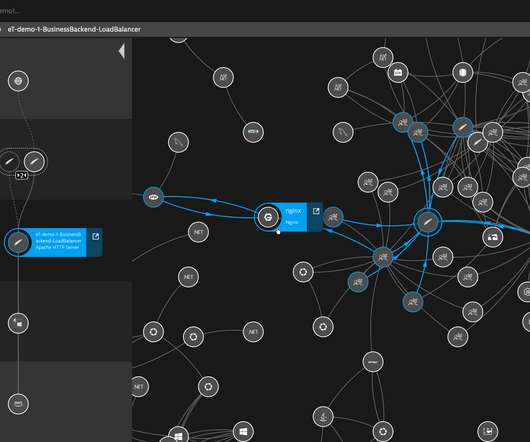
Such applications track the inventory of our network gear: what devices, of which models, with which hardware components, located in which sites. Demand Engineering Demand Engineering is responsible for Regional Failovers , Traffic Distribution, Capacity Operations and Fleet Efficiency of the Netflix cloud.
By leveraging the Dynatrace Operator and Dynatrace capabilities on Red Hat OpenShift on IBM Power, customers can accelerate their modernization to hybrid cloud and increase operational efficiencies with greater visibility across the full stack from hardware through application processes.
Container technology is very powerful as small teams can develop and package their application on laptops and then deploy it anywhere into staging or production environments without having to worry about dependencies, configurations, OS, hardware, and so on. The time and effort saved with testing and deployment are a game-changer for DevOps.
This enables organizations to innovate faster, collaborate more efficiently, and deliver more value with dramatically less effort. There’s a more efficient way with Dynatrace. And even Digital business analytics. Read below to see what you get with the Dynatrace platform.
Key Takeaways Distributed storage systems benefit organizations by enhancing data availability, fault tolerance, and system scalability, leading to cost savings from reduced hardware needs, energy consumption, and personnel. This strategy reduces the volume needed during retrieval operations.
There’s a more efficient way with Dynatrace! You can’t keep pace by simply upgrading to the latest hardware and updating to the latest release twice a year. AppMon is still the best-in-class second-generation APM solution, but it requires you to instrument each process manually and pick the corresponding agent technology.
We will also discuss related configuration variables to consider that can impact these KPIs, helping you gain a comprehensive understanding of your MySQL server’s performance and efficiency. Query performance Query performance is a key performance indicator (KPI) in MySQL, as it measures the efficiency and speed of query execution.
Understanding Power BI Definition and Purpose Power BI is a business analytics service that can gather all your data in a single platform and enable users to analyze and visualize easily. Benefits of Power BI The advantages of Power BI are manifold, from its intuitive interface to its ability to handle large datasets efficiently.
ScaleGrid’s comprehensive solutions provide automated efficiency and cost reduction while offering tailored features such as predictive analytics for businesses of all sizes. This includes being able to select the right hardware options for the job, enforcing desired safety measures, and having access to a variety of database software.
This ensures each Redis instance optimally uses the in-memory data store and aligns with the operating system’s efficiency. Command-Line Analysis Commanding the Redis CLI efficiently requires knowledge of every commands function and how to decipher its output. Its equally important to put preventative measures in place.
There are many more opportunities to customize your infrastructure with an on-premise setup, but requires a significant upfront investment in hardware and software computing resources, as well as on-going maintenance responsibilities.
Inside, you will learn: Why you should upgrade MongoDB Staying with outdated MongoDB versions can expose you to critical security vulnerabilities, suboptimal performance, and missed opportunities for efficiency. Introduction of clustered collections for optimized analytical queries. In MongoDB 6.x:
This ensures each Redis® instance optimally uses the in-memory data store and aligns with the operating system’s efficiency. Command-Line Analysis Commanding the Redis CLI efficiently requires knowledge of every command’s function and how to decipher its output. It’s equally important to put preventative measures in place.
Now that our ability to generate higher and higher clock rates has stalled and CPU architectural improvements have shifted focus towards multiple cores, we see that it is becoming harder to efficiently use these computer systems. Driving down the cost of Big-Data analytics. General Purpose GPU programming.
The engine should be compact and efficient, so one can deploy it in multiple datacenters on small clusters. Thus, on a conceptual level, an efficient query engine in a distributed database can act as a stream processing system and vice versa, a stream processing system can act as a distributed database query engine. Pipelining.
If executed efficiently with maximum coverage, can confirm the stability and workability of the application. Hardware Compatibility Testing: In this scenario, an application is tested against various hardware configurations to check behavior. Types of Compatibility Testing.
In traditional database architectures, database engines often run a small search engine or data warehouse engines on the same hardware as the database. Also, you can choose to program post-commit actions, such as running aggregate analytical functions or updating other dependent tables.
Software and hardware components are autonomous and execute tasks concurrently. A distributed system comprises of a variety of hardware and software components with different operating systems and technologies, meaning the processors are separate and independent of each other. State is distributed through the system. Concurrency.
DynamoDB frees developers from the headaches of provisioning hardware and software, setting up and configuring a distributed database cluster, and managing ongoing cluster operations. Additional request capacity is priced at cost-efficiently hourly rates as low as $.01
Smart manufacturers are always looking for ways to decrease operating expenses, increase overall efficiency, reduce downtime, and maximize production. Using real-time streaming data and analytics, manufacturers can optimize workflows in the moment, reducing bottlenecks and minimizing downtime.
Site reliability engineers are focused with creating scalable and reliable software systems, so this also includes ensuring that development work is efficient and reliable, so when the finished product is ready for production, there are no surprises. that are required to keep the software deployments live are running efficiently.
That pricing won’t be sustainable, particularly as hardware shortages drive up the cost of building infrastructure. Several respondents also mentioned working with video: analyzing video data streams, video analytics, and generating or editing videos. It’s good to see issues like safety and security near the top of the list.
By ITIL definition, the service desk may take the form of incident resolution or service requests, but whatever the case, the primary goal of the service desk to provide quick and efficient service. Software services still require physical devices and hardware for them to function. Problem Management. Asset Management.
It enables the user to measure database performance and make comparative judgements about database hardware and software. The TPC designed benchmarks for transaction processing (OLTP) and analytics (OLAP) and anyone can run these benchmarks, have them audited by the TPC and published on the official benchmark rankings.
It can be used to power new analytics, insight, and product features. It can be used to power new analytics, insight, and product features. A data pipeline is a software which runs on hardware. The software is error-prone and hardware failures are inevitable. Data pipeline initiatives are generally unfinished projects.
how much data does the browser have to download to display your website) and resource usage of the hardware serving and receiving the website. It seems to have become more-or-less ubiquitous on the web for everyone to analyze what their website’s visitors do via tools like Google Analytics, KISSmetrics, Piwik, etc.
Online analytical processing , OLAP : Online analytical processing applications enable users to analyze multidimensional data interactively from multiple perspectives which consist of three basic analytical operations: . But while eminently capable of performing OLAP, it’s not quite as efficient. consolidation (roll-up).
Andrew Ng , Christopher Ré , and others have pointed out that in the past decade, we’ve made a lot of progress with algorithms and hardware for running AI. Our current set of AI algorithms are good enough, as is our hardware; the hard problems are all about data. But the gain in efficiency would be relatively small.
Could it be Analyzing efficient stream processing on modern hardware ? Hyper Dimension Shuffle describes how Microsoft improved the cost of data shuffling, one of the most costly operations, in their petabyte-scale internal big data analytics platform, SCOPE. for machine generated emails sent to humans). What’s their secret???
The benefit for customers: Authorized users can view this data and therefore manage their inventories across different sites, making the maintenance processes much more efficient. We need mechanisms that enable the mass production of data using software and hardware capabilities. This pattern should be broken.
We organize all of the trending information in your field so you don't have to. Join 5,000+ users and stay up to date on the latest articles your peers are reading.
You know about us, now we want to get to know you!
Let's personalize your content
Let's get even more personalized
We recognize your account from another site in our network, please click 'Send Email' below to continue with verifying your account and setting a password.


Let's personalize your content