This site uses cookies to improve your experience. To help us insure we adhere to various privacy regulations, please select your country/region of residence. If you do not select a country, we will assume you are from the United States. Select your Cookie Settings or view our Privacy Policy and Terms of Use.
Cookie Settings
Cookies and similar technologies are used on this website for proper function of the website, for tracking performance analytics and for marketing purposes. We and some of our third-party providers may use cookie data for various purposes. Please review the cookie settings below and choose your preference.
Used for the proper function of the website
Used for monitoring website traffic and interactions
Cookie Settings
Cookies and similar technologies are used on this website for proper function of the website, for tracking performance analytics and for marketing purposes. We and some of our third-party providers may use cookie data for various purposes. Please review the cookie settings below and choose your preference.
Strictly Necessary: Used for the proper function of the website
Performance/Analytics: Used for monitoring website traffic and interactions
Leverage AI for proactive protection: AI and contextual analytics are game changers, automating the detection, prevention, and response to threats in real time. UMELT are kept cost-effectively in a massive parallel processing data lakehouse, enabling contextual analytics at petabyte scale, fast.
Vulnerabilities can enter the software development lifecycle (SDLC) at any stage and can have significant impact if left undetected. As a result, organizations are implementing security analytics to manage risk and improve DevSecOps efficiency. What is security analytics? Why is security analytics important?
By following key log analytics and log management best practices, teams can get more business value from their data. Challenges driving the need for log analytics and log management best practices As organizations undergo digital transformation and adopt more cloud computing techniques, data volume is proliferating.
The Dynatrace platform automatically captures and maps metrics, logs, traces, events, user experience data, and security signals into a single datastore, performing contextual analytics through a “power of three AI”—combining causal, predictive, and generative AI. The result?
Log monitoring, log analysis, and log analytics are more important than ever as organizations adopt more cloud-native technologies, containers, and microservices-based architectures. Log monitoring is a process by which developers and administrators continuously observe logs as they’re being recorded. What is log analytics?
Much of the software developed today is cloud native. Organizations need to unify all this observability, business, and security data based on context and generate real-time insights to inform actions taken by automation systems, as well as business, development, operations, and security teams. Enter Grail-powered data and analytics.
Today, development teams suffer from a lack of automation for time-consuming tasks, the absence of standardization due to an overabundance of tool options, and insufficiently mature DevSecOps processes. This leads to frustrating bottlenecks for developers attempting to build and deliver software.
New technologies like Xamarin or React Native are accelerating the speed at which organizations release new features and unlock market reach. How do I connect the dots between mobile analytics and performance monitoring? Connect the dots between mobile analytics and performance monitoring with mobile business analytics.
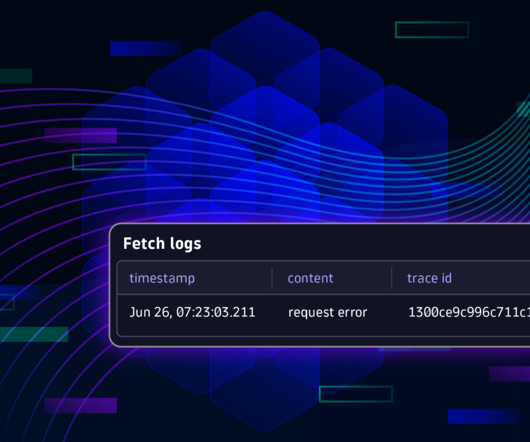
What is log analytics? Log analytics is the process of viewing, interpreting, and querying log data so developers and IT teams can quickly detect and resolve application and system issues. In what follows, we explore log analytics benefits and challenges, as well as a modern observability approach to log analytics.
What is log analytics? Log analytics is the process of viewing, interpreting, and querying log data so developers and IT teams can quickly detect and resolve application and system issues. In what follows, we explore log analytics benefits and challenges, as well as a modern observability approach to log analytics.
The complexity of such deployments has accelerated with the adoption of emerging, open-source technologies that generate telemetry data, which is exploding in terms of volume, speed, and cardinality. Dynatrace extends its unique topology-based analytics and AIOps approach. If so, what is the root cause and suggested remediation?
Mobile app monitoring and mobile analytics make this possible. By providing insight into how apps are operating and why they crash, mobile analytics lets you know what’s happening with your apps and what steps you can take to solve potential problems. What is mobile analytics? Why use mobile analytics and app monitoring?
A traditional log-based SIEM approach to security analytics may have served organizations well in simpler on-premises environments. Additionally, Runtime Application Protection provides the ability to protect from attacks while giving development teams much-needed time to remediate these vulnerabilities.
Thunderhead is the recognized global leader in the Customer Journey Orchestration and Analytics market. To continue to improve user experience with their highly-visual web application, Thunderhead develops continuously. The ONE Engagement Hub helps global brands build customer engagement in the era of digital transformation.
Although most organizations invest in innovative mobile app development, not many allocate enough resources toward delivering and measuring the high-quality user experiences customers expect. Mobile analytics can help organizations optimize their mobile application performance, earning customer accolades and increasing revenue in the process.
Our latest enhancements to the Dynatrace Dashboards and Notebooks apps make learning DQL optional in your day-to-day work, speeding up your troubleshooting and optimization tasks. This app provides advanced analytics, such as highlighting related surrounding traces and pinpointing the root cause, as illustrated in the example below.
Kafka is optimized for high-throughput event streaming , excelling in real-time analytics and large-scale data ingestion. Its architecture supports stream transformations, joins, and filtering, making it a powerful tool for real-time analytics. Apache Kafka, designed for distributed event streaming, maintains low latency at scale.
As organizations look to expand DevOps maturity, improve operational efficiency, and increase developer velocity, they are embracing platform engineering as a key driver. The goal is to abstract away the underlying infrastructure’s complexities while providing a streamlined and standardized environment for development teams.
It helps create patterns, provides instant feedback, and allows you to save and reuse DPL patterns, for faster access to data analytics use cases. Figure 2: Choose from a list of available patterns Developing a new pattern using DPL Architect DPL Architect helps you by creating your own patterns and provides instant feedback.
With segments, you can isolate particular OpenPipeline log sources, resource entities, cloud regions, or even certain buckets your developers use. Simplified collaboration Individual users and teams can share segments to ensure consistent filtering logic across apps, dashboards, or even business analytics use cases.
In what follows, we explore some key cloud observability trends in 2023, such as workflow automation and exploratory analytics. From data lakehouse to an analytics platform Traditionally, to gain true business insight, organizations had to make tradeoffs between accessing quality, real-time data and factors such as data storage costs.
At the 2024 Dynatrace Perform conference in Las Vegas, Michael Winkler, senior principal product management at Dynatrace, ran a technical session exploring just some of the many ways in which Dynatrace helps to automate the processes around development, releases, and operation. Real-time detection for fast remediation.
Greenplum Database is an open-source , hardware-agnostic MPP database for analytics, based on PostgreSQL and developed by Pivotal who was later acquired by VMware. This feature-packed database provides powerful and rapid analytics on data that scales up to petabyte volumes. What Exactly is Greenplum? At a glance – TLDR.
We’re able to help drive speed, take multiple data sources, bring them into a common model and drive those answers at scale.”. As the number of apps and services deployed increases, teams face increased pressure to speed up native mobile app innovation and resolve app issues quicker. Next-gen Infrastructure Monitoring.
Logs assist operations, security, and development teams in ensuring the reliability and performance of application environments. These traditional approaches to log monitoring and log analytics thwart IT teams’ goal to address infrastructure performance problems, security threats, and user experience issues.
In what follows, we define software automation as well as software analytics and outline their importance. What is software analytics? This involves big data analytics and applying advanced AI and machine learning techniques, such as causal AI. We also discuss the role of AI for IT operations (AIOps) and more.
These criteria include operational excellence, security and data privacy, speed to market, and disruptive innovation. With the insights they gained, the team expanded into developing workflow automations using log management and analytics powered by the Grail data lakehouse.
As businesses take steps to innovate faster, software development quality—and application security—have moved front and center. That can be difficult when the business climate can prioritize speed. Indeed, according to one survey, DevOps practices have led to 60% of developers releasing code twice as quickly. and 2.14.1.
All of the popular speed testing tools typically provide a page speed score along with their objective results. Google PageSpeed Insights has a their “Speed Score.” While these do have a purpose, most people use them incorrectly, in a way that can be dangerous to your real site speed. seconds to.27 27 seconds!
Log collection platforms, such as Fluent Bit, give organizations a much-needed solution for quickly gathering and processing log data to make it available in different backends for further analytics. Speed up your troubleshooting processes Log analysis is typically the first step in the troubleshooting process.
Organizations across industries are embracing generative AI, a technology that promises faster development and increased productivity. Our guide covers AI for effective DevSecOps, converging observability and security, and cybersecurity analytics for threat detection and response. Learn more in this blog.
Deploy risk-based estimates and models with confidence, accuracy, transparency, and speed. This enables banks to manage risk with the speed and precision mandated by their markets. Collect data automatically and pre-processed from a range of sources: application programming interfaces, integrations, agents, and OpenTelemetry.
And specifically, how Dynatrace can help partners deliver multicloud performance and boundless analytics for their customers’ digital transformation and success. We know that meaningful results are achieved when customer experience is optimized by our partners, and this year, Dynatrace has developed new avenues to help promote this.
The development of internal platform teams has taken off in the last three years, primarily in response to the challenges inherent in scaling modern, containerized IT infrastructures. The old saying in the software development community, “You build it, you run it,” no longer works as a scalable approach in the modern cloud-native world.
Log management and analytics have become a particular challenge. And 93% of CIOs say AIOps and automation are increasingly vital to alleviating the shortage of skilled IT, development, and security professional. Enlisting a data lakehouse, IT automation can manage the next wave of cloud complexity.
For example, nearly two-thirds (61%) of technology leaders say they will increase investment in AI over the next 12 months to speed software development. According to “The state of AI” report, nearly three-quarters of IT operations, development, and security teams plan to use AI to become more proactive in executing their work.
From generating new code and boosting developer productivity to finding the root cause of performance issues with ease, the benefits of AI are numerous. Organizations that miss out on implementing AI risk falling behind their competition in an age where software delivery speed, agility, and security are crucial success factors.
By incorporating automated vulnerability scans within the software development lifecycle (SDLC), developers can expedite the release of innovative software features. This eliminates the additional burden of manual vulnerability scans, enabling teams to identify and address vulnerabilities during the development phase.
With improved diagnostic and analytic capabilities, DevOps teams can spend less time troubleshooting. Instead, they can apply their talent to developing innovative new features that benefit users and move the business forward. Improve business decisions with precision analytics. See observability in action!
This empowers application teams to gain fast and relevant insights effortlessly, as Dynatrace provides logs in context, with all essential details and unique insights at speed. Collaborating with your peers based on your software development lifecycle and all data in context has never been easier.
This improves query speeds and reduces related costs for all other teams and apps. In that case, the use of separate buckets makes it easier to distinguish different stages, keeping production data separate from development or staging data. Keeping these logs separate decreases the data volume for other troubleshooting logs.
Many of these innovations will have a significant analytics component or may even be completely driven by it. For example many of the Internet of Things innovations that we have seen come to life in the past years on AWS all have a significant analytics components to it. Cloud analytics are everywhere.
Serverless functions extend applications to accelerate speed of innovation. These serverless functions allow developers to focus on their business logic. From here you can use Dynatrace analytics capabilities to understand the response time, or failures, or jump to individual PurePaths.
Align business and development teams’ input on what user experience metrics to measure to understand users’ most critical digital experience aspects. Speed index. This allows ITOps to measure each user journey’s effectiveness and efficiency. Visually complete. The time to fully render content in viewpoint.
We organize all of the trending information in your field so you don't have to. Join 5,000+ users and stay up to date on the latest articles your peers are reading.
You know about us, now we want to get to know you!
Let's personalize your content
Let's get even more personalized
We recognize your account from another site in our network, please click 'Send Email' below to continue with verifying your account and setting a password.


Let's personalize your content