This site uses cookies to improve your experience. To help us insure we adhere to various privacy regulations, please select your country/region of residence. If you do not select a country, we will assume you are from the United States. Select your Cookie Settings or view our Privacy Policy and Terms of Use.
Cookie Settings
Cookies and similar technologies are used on this website for proper function of the website, for tracking performance analytics and for marketing purposes. We and some of our third-party providers may use cookie data for various purposes. Please review the cookie settings below and choose your preference.
Used for the proper function of the website
Used for monitoring website traffic and interactions
Cookie Settings
Cookies and similar technologies are used on this website for proper function of the website, for tracking performance analytics and for marketing purposes. We and some of our third-party providers may use cookie data for various purposes. Please review the cookie settings below and choose your preference.
Strictly Necessary: Used for the proper function of the website
Performance/Analytics: Used for monitoring website traffic and interactions
As cloud complexity increases and security concerns mount, organizations need log analytics to discover and investigate issues and gain critical business intelligence. But exploring the breadth of log analytics scenarios with most log vendors often results in unexpectedly high monthly log bills and aggressive year-over-year costs.
Developers are key stakeholders in modern observability. In this blog post, we will see how Dynatrace harnesses the power of observability and analytics to tailor a new experience to easily extend to the left, allowing developers to solve issues faster, build more efficient software, and ultimately improve developer experience!
This article is the second in a multi-part series sharing a breadth of Analytics Engineering work at Netflix, recently presented as part of our annual internal Analytics Engineering conference. To facilitate easier access to incrementality results, we have developed an interactive tool powered by this framework.
Vulnerabilities can enter the software development lifecycle (SDLC) at any stage and can have significant impact if left undetected. As a result, organizations are implementing security analytics to manage risk and improve DevSecOps efficiency. What is security analytics? Why is security analytics important?
Key insights for executives: Optimize customer experiences through end-to-end contextual analytics from observability, user behavior, and business data. Consolidate real-user monitoring, synthetic monitoring, session replay, observability, and business process analytics tools into a unified platform. Google or Adobe Analytics).
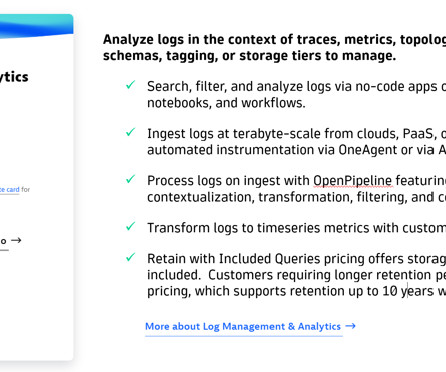
Dynatrace enables various teams, such as developers, threat hunters, business analysts, and DevOps, to effortlessly consume advanced log insights within a single platform. This is explained in detail in our blog post, Unlock log analytics: Seamless insights without writing queries.
Its AI-driven exploratory analytics help organizations navigate modern software deployment complexities, quickly identify issues before they arise, shorten remediation journeys, and enable preventive operations. AI-driven analytics transform data analysis, making it faster and easier to uncover insights and act.
As user experiences become increasingly important to bottom-line growth, organizations are turning to behavior analytics tools to understand the user experience across their digital properties. Here’s what these analytics are, how they work, and the benefits your organization can realize from using them.
This results in site reliability engineers nudging development teams to add resource attributes, endpoints, and tokens to their source code. Second, embracing the complexity of OpenTelemetry signal collection must come with a guaranteed payoff: gaining analytical insights and causal relationships that improve business performance.
By following key log analytics and log management best practices, teams can get more business value from their data. Challenges driving the need for log analytics and log management best practices As organizations undergo digital transformation and adopt more cloud computing techniques, data volume is proliferating.
Executives invest in Dynatrace to enable their IT operations, security, and development teams to maintain visibility into all their digital services and ensure flawless, secure digital interactions. Executives drive business growth through strategic decisions, relying on data analytics for crucial insights.
Log monitoring, log analysis, and log analytics are more important than ever as organizations adopt more cloud-native technologies, containers, and microservices-based architectures. Log monitoring is a process by which developers and administrators continuously observe logs as they’re being recorded. What is log analytics?
What is customer experience analytics: Fostering data-driven decision making In today’s customer-centric business landscape, understanding customer behavior and preferences is crucial for success. By gathering a range of data, organizations can develop a holistic view of customer journeys and uncover meaningful patterns and trends.
This blog post will explore these exciting developments and what they mean for organizations. By automating OneAgent deployment at the image creation stage, organizations can immediately equip every EC2 instance with real-time monitoring and AI-powered analytics.
When it comes to mobile monitoring, everyone has their own point of view… Mobile is not a single technology: it involves different development teams handling Android and iOS apps, performance engineering teams, cloud operations, and marketing. How do I connect the dots between mobile analytics and performance monitoring?
What is log analytics? Log analytics is the process of viewing, interpreting, and querying log data so developers and IT teams can quickly detect and resolve application and system issues. In what follows, we explore log analytics benefits and challenges, as well as a modern observability approach to log analytics.
With 99% of organizations using multicloud environments , effectively monitoring cloud operations with AI-driven analytics and automation is critical. IT operations analytics (ITOA) with artificial intelligence (AI) capabilities supports faster cloud deployment of digital products and services and trusted business insights.
What is log analytics? Log analytics is the process of viewing, interpreting, and querying log data so developers and IT teams can quickly detect and resolve application and system issues. In what follows, we explore log analytics benefits and challenges, as well as a modern observability approach to log analytics.
Today, development teams suffer from a lack of automation for time-consuming tasks, the absence of standardization due to an overabundance of tool options, and insufficiently mature DevSecOps processes. This leads to frustrating bottlenecks for developers attempting to build and deliver software.
Mobile app monitoring and mobile analytics make this possible. By providing insight into how apps are operating and why they crash, mobile analytics lets you know what’s happening with your apps and what steps you can take to solve potential problems. What is mobile analytics? Why use mobile analytics and app monitoring?
Much of the software developed today is cloud native. Organizations need to unify all this observability, business, and security data based on context and generate real-time insights to inform actions taken by automation systems, as well as business, development, operations, and security teams. Enter Grail-powered data and analytics.
Azure observability and Azure data analytics are critical requirements amid the deluge of data in Azure cloud computing environments. As digital transformation accelerates and more organizations are migrating workloads to Azure and other cloud environments, they need observability and data analytics capabilities that can keep pace.
A traditional log-based SIEM approach to security analytics may have served organizations well in simpler on-premises environments. Additionally, Runtime Application Protection provides the ability to protect from attacks while giving development teams much-needed time to remediate these vulnerabilities.
With extended contextual analytics and AIOps for open observability, Dynatrace now provides you with deep insights into every entity in your IT landscape, enabling you to seamlessly integrate metrics, logs, and traces—the three pillars of observability. Dynatrace extends its unique topology-based analytics and AIOps approach.
Exploding volumes of business data promise great potential; real-time business insights and exploratory analytics can support agile investment decisions and automation driven by a shared view of measurable business goals. Traditional observability solutions don’t capture or analyze application payloads. What’s next?
Administrators who work with developers and product managers responsible for instrumenting, managing, and achieving the business goals of applications benefit from Dynatrace log management. Log management with adherence to industry-specific compliance requirements is more critical than ever. Want to learn more?
Membership in MISA is nomination-only and reserved for independent software vendors who develop security solutions that effectively integrate with MISA-qualifying Microsoft Security products. They can automatically identify vulnerabilities, measure risks, and leverage advanced analytics and automation to mitigate issues.
Although most organizations invest in innovative mobile app development, not many allocate enough resources toward delivering and measuring the high-quality user experiences customers expect. Mobile analytics can help organizations optimize their mobile application performance, earning customer accolades and increasing revenue in the process.
Protect data in multi-tenant architectures To bring you the most value by unifying observability and security in one analytics and automation platform powered by AI, Dynatrace SaaS leverages a multitenancy architecture, enabling efficient and scalable data ingestion, querying, and processing on shared infrastructure.
The Dynatrace platform automatically captures and maps metrics, logs, traces, events, user experience data, and security signals into a single datastore, performing contextual analytics through a “power of three AI”—combining causal, predictive, and generative AI. The result?
EasyTrade Analytics is a hypothetical stockbroker app developed by two members of the Platform enablement team, Sinisa Zubic and Edu Campver. This face-to-face interaction helped stimulate great conversation with the attendees and allowed us to go deeper into relevant topics of app development and help them get the most from the class.
Her strategic approach to talent management, diversity and inclusion, and organizational development has created an atmosphere that empowers each Dynatracer to excel. “Creating an environment where every individual can thrive is my passion, said Sue Quackenbush.
As organizations look to expand DevOps maturity, improve operational efficiency, and increase developer velocity, they are embracing platform engineering as a key driver. The goal is to abstract away the underlying infrastructure’s complexities while providing a streamlined and standardized environment for development teams.
Uber uses Presto, an open-source distributed SQL query engine, to provide analytics across several data sources, including Apache Hive, Apache Pinot, MySQL, and Apache Kafka. To improve its performance, Uber engineers explored the advantages of dealing with quick queries, a.k.a.
Sometimes overlooked is a fourth category we might call long-tail processes; these are the ad hoc or custom workflows that develop in response to gaps between systems, applications, departments, or workflows. These benefits come from robust process analytics, often augmented by AI.
Kafka is optimized for high-throughput event streaming , excelling in real-time analytics and large-scale data ingestion. Its architecture supports stream transformations, joins, and filtering, making it a powerful tool for real-time analytics. Apache Kafka, designed for distributed event streaming, maintains low latency at scale.
Accelerate data exploration with seamless integration between apps In developing the new Dynatrace experience, our goal was to integrate apps seamlessly by sharing the context when navigating between them (known as “intent”), much like sharing a photo from your smartphone to social media.
At the 2024 Dynatrace Perform conference in Las Vegas, Michael Winkler, senior principal product management at Dynatrace, ran a technical session exploring just some of the many ways in which Dynatrace helps to automate the processes around development, releases, and operation. Real-time detection for fast remediation.
Seek out solutions that leverage real-time analytics to automatically understand how application and infrastructure conditions are changing, where new demand is coming from, and when service-level objectives are not being met.
Greenplum Database is an open-source , hardware-agnostic MPP database for analytics, based on PostgreSQL and developed by Pivotal who was later acquired by VMware. This feature-packed database provides powerful and rapid analytics on data that scales up to petabyte volumes. What Exactly is Greenplum? At a glance – TLDR.
Improving collaboration across teams By surfacing actionable insights and centralized monitoring data, Dynatrace fosters collaboration between development, operations, security, and business teams. Once the data is formatted, it is ingested into Dynatrace Business Analytics using the Dynatrace SDK.
This enables our customers to empower their teams to achieve more with data and get the most out of Dynatrace, the only analytics and automation platform powered by causal AI: Business teams can deliver experiences customers love and increase conversions by up to 25%.
ERP systems are crucial in modern software development because they integrate various organizational departments and functions. ERP systems offer standardized processes, enabling developers to accelerate development cycles and align with industry best practices.
However, the 2024 State of Observability report from Dynatrace reveals that the explosion of data generated by these complex ecosystems is pushing traditional monitoring and analytics approaches to their limits. They enable developers, engineers, and architects to drive innovation, but they also introduce new challenges."
We organize all of the trending information in your field so you don't have to. Join 5,000+ users and stay up to date on the latest articles your peers are reading.
You know about us, now we want to get to know you!
Let's personalize your content
Let's get even more personalized
We recognize your account from another site in our network, please click 'Send Email' below to continue with verifying your account and setting a password.


Let's personalize your content