This site uses cookies to improve your experience. To help us insure we adhere to various privacy regulations, please select your country/region of residence. If you do not select a country, we will assume you are from the United States. Select your Cookie Settings or view our Privacy Policy and Terms of Use.
Cookie Settings
Cookies and similar technologies are used on this website for proper function of the website, for tracking performance analytics and for marketing purposes. We and some of our third-party providers may use cookie data for various purposes. Please review the cookie settings below and choose your preference.
Used for the proper function of the website
Used for monitoring website traffic and interactions
Cookie Settings
Cookies and similar technologies are used on this website for proper function of the website, for tracking performance analytics and for marketing purposes. We and some of our third-party providers may use cookie data for various purposes. Please review the cookie settings below and choose your preference.
Strictly Necessary: Used for the proper function of the website
Performance/Analytics: Used for monitoring website traffic and interactions
This article is the first in a multi-part series sharing a breadth of Analytics Engineering work at Netflix, recently presented as part of our annual internal Analytics Engineering conference. Subsequent posts will detail examples of exciting analytic engineering domain applications and aspects of the technical craft.
This article is the second in a multi-part series sharing a breadth of Analytics Engineering work at Netflix, recently presented as part of our annual internal Analytics Engineering conference. To better guide the design and budgeting of future campaigns, we are developing an Incremental Return on Investment model.
As a result, organizations are implementing security analytics to manage risk and improve DevSecOps efficiency. Fortunately, CISOs can use security analytics to improve visibility of complex environments and enable proactive protection. What is security analytics? Why is security analytics important? Here’s how.
Metadata enrichment improves collaboration and increases analytic value. The Dynatrace® platform continues to increase the value of your data — broadening and simplifying real-time access, enriching context, and delivering insightful, AI-augmented analytics. Our Business Analytics solution is a prominent beneficiary of this commitment.
Design a photo-sharing platform similar to Instagram where users can upload their photos and share it with their followers. High Level Design. Component Design. API Design. We have provided the API design of posting an image on Instagram below. API Design. Problem Statement. Architecture. Data Models.
This year’s AWS re:Invent will showcase a suite of new AWS and Dynatrace integrations designed to enhance cloud performance, security, and automation. By automating OneAgent deployment at the image creation stage, organizations can immediately equip every EC2 instance with real-time monitoring and AI-powered analytics.
By following key log analytics and log management best practices, teams can get more business value from their data. Challenges driving the need for log analytics and log management best practices As organizations undergo digital transformation and adopt more cloud computing techniques, data volume is proliferating.
Following the launch of Dynatrace® Grail for Log Management and Analytics , we’re excited to announce a major update to our Business Analytics solution. Since they rely on capabilities designed for IT monitoring, they inherit a series of architectural design constraints that limit their usefulness.
We introduced Dynatrace’s Digital Business Analytics in part one , as a way for our customers to tie business metrics to application performance and user experience, delivering unified insights into how these metrics influence business milestones and KPIs. Only with Dynatrace Digital Busines Analytics. Then what happens next?
Grail – the foundation of exploratory analytics Grail can already store and process log and business events. Let Grail do the work, and benefit from instant visualization, precise analytics in context, and spot-on predictive analytics. You no longer need to split, distribute, or pre-aggregate your data.
In fact, for most of us, has become a priority, requiring us to expand our focus on observability to include business analytics metrics. With Dynatrace Business Analytics , you know in real-time when business KPIs–conversions, quotes, payments, registrations, purchases, etc.–degrade. Below is the survey summary. Want to learn more?
Azure observability and Azure data analytics are critical requirements amid the deluge of data in Azure cloud computing environments. As digital transformation accelerates and more organizations are migrating workloads to Azure and other cloud environments, they need observability and data analytics capabilities that can keep pace.
Unlike web technologies, which support a wide range of applications from webpage serving to API interactions, ADS-B is designed explicitly for real-time physical tracking and monitoring in aviation—just like any other IoT monitoring solution in the earlier mentioned verticals. Download the JSON files from GitHub.
IT pros want a data and analytics solution that doesn’t require tradeoffs between speed, scale, and cost. With a data and analytics approach that focuses on performance without sacrificing cost, IT pros can gain access to answers that indicate precisely which service just went down and the root cause. Real-time anomaly detection.
To continue down the carbon reduction path, IT leaders must drive carbon optimization initiatives into the hands of IT operations teams, arming them with the tools needed to support analytics and optimization. Thermal design power (TDP) values are derived from AMD and Intel to calculate CPU power consumption.
How do I connect the dots between mobile analytics and performance monitoring? Data privacy by design allows Session Replay to automatically mask each mobile user’s personally identifiable information (PII) data. Connect the dots between mobile analytics and performance monitoring with mobile business analytics.
In the field of big data analytics, Apache Doris and Elasticsearch (ES) are frequently utilized for real-time analytics and retrieval tasks. However, their design philosophies and technical focuses differ significantly.
Protect data in multi-tenant architectures To bring you the most value by unifying observability and security in one analytics and automation platform powered by AI, Dynatrace SaaS leverages a multitenancy architecture, enabling efficient and scalable data ingestion, querying, and processing on shared infrastructure.
They can automatically identify vulnerabilities, measure risks, and leverage advanced analytics and automation to mitigate issues. “With Dynatrace, teams gain end-to-end observability and security across all workloads. Equipped with information about these vulnerabilities, organizations can take steps to reduce their future risk.
In this blog post, we will see how Dynatrace harnesses the power of observability and analytics to tailor a new experience to easily extend to the left, allowing developers to solve issues faster, build more efficient software, and ultimately improve developer experience!
In this post, I wanted to share how I use Google Analytics together with Dynatrace to give me a more complete picture of my customers, and their experience across our digital channels. Google Analytics. Almost all marketers will be familiar with Google Analytics. Digital and Business Analytics. So we turned it off.
RabbitMQ is designed for flexible routing and message reliability, while Kafka handles high-throughput event streaming and real-time data processing. Kafka is optimized for high-throughput event streaming , excelling in real-time analytics and large-scale data ingestion.
By putting data in context, OpenPipeline enables the Dynatrace platform to deliver AI-driven insights, analytics, and automation for customers across observability, security, software lifecycle, and business domains. This “data in context” feeds Davis® AI, the Dynatrace hypermodal AI , and enables schema-less and index-free analytics.
Creating an ecosystem that facilitates data security and data privacy by design can be difficult, but it’s critical to securing information. When organizations focus on data privacy by design, they build security considerations into cloud systems upfront rather than as a bolt-on consideration.
Microsoft Azure SQL is a robust, fully managed database platform designed for high-performance querying, relational data storage, and analytics. An application software generates user metrics on a daily basis, which can be used for reports or analytics.
They offer a comprehensive end-to-end solution to these challenges, providing functionalities designed to enhance compliance and resilience in IT environments. Problems utilizes Davis AI to automatically analyze your system and detect abnormal behavior, such as performance or stability issues.
As networks scale exponentially, classical topologies and designs are struggling to keep in sync with the rapidly evolving demands of the modern IT infrastructure. IBN is a natural progression of SDN that combines intelligence, analytics, machine learning , and orchestration to automate network management.
Ready-made dashboards and notebooks address this concern by offering pre-configured data visualizations and filters designed for common scenarios like troubleshooting and optimization. This app provides advanced analytics, such as highlighting related surrounding traces and pinpointing the root cause, as illustrated in the example below.
Greenplum Database is an open-source , hardware-agnostic MPP database for analytics, based on PostgreSQL and developed by Pivotal who was later acquired by VMware. This feature-packed database provides powerful and rapid analytics on data that scales up to petabyte volumes. Greenplum Architectural Design. Greenplum Advantages.
Once the data is formatted, it is ingested into Dynatrace Business Analytics using the Dynatrace SDK. Next steps: Unlock the potential of GitHub data in Dynatrace The examples provided were designed to be straightforward and easy to implement, offering a foundation for integrating GitHub data into Dynatrace.
Uber uses Presto, an open-source distributed SQL query engine, to provide analytics across several data sources, including Apache Hive, Apache Pinot, MySQL, and Apache Kafka. To improve its performance, Uber engineers explored the advantages of dealing with quick queries, a.k.a.
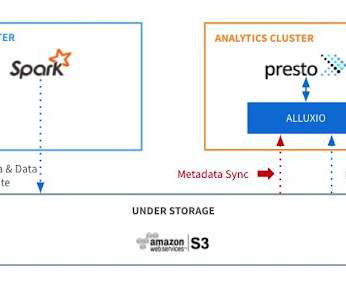
This article describes the design and the implementation in Alluxio to keep metadata synchronized. Metadata synchronization (sync) is a core feature in Alluxio that keeps files and directories consistent with their source of truth in under-storage systems, thus making it simple for users to reason the data retrieved from Alluxio.
Regardless of their role, every business process is designed to improve business outcomes. But even the best BPM solutions lack the IT context to support actionable process analytics; this is the opportunity for observability platforms. These benefits come from robust process analytics, often augmented by AI.
The Dynatrace platform now enables comprehensive data exploration and interactive analytics across data sets (trace, logs, events, and metrics)empowering you to solve complex use cases, handle any observability scenario, and gain unprecedented visibility into your systems. Get ready to experience a whole new world of limitless tracing power.
This structure works surprisingly well for many important workloads like database, search, and analytics. The admission window provides a small region for recency bursts to avoid consecutive misses when an item is building up its popularity.
Monitor your cloud OpenPipeline ™ is the Dynatrace platform data-handling solution designed to seamlessly ingest and process data from any source, regardless of scale or format. Furthermore, OpenPipeline is designed to collect and process data securely and in compliance with industry standards.
It should be open by design to accelerate innovation, enable powerful integration with other tools, and purposefully unify data and analytics. Enter Grail-powered data and analytics. Grail makes converging real-time, historical, and predictive analytics possible on a single platform.
Dynatrace offers essential analytics and automation to keep applications optimized and businesses flourishing. By seamlessly integrating observability, AI-driven insights, and data analytics, organizations can overcome common obstacles such as operational inefficiencies, performance bottlenecks, and scalability concerns.
There are 2 major challenges to succeed in our mission: We want to democratize the platform and create a contribution model: with a developer and production deployment experience that is designed for data scientists and friendly to the stacks they use. To facilitate a smooth data flow, we need to design simple connectors.
The team transforms Uber’s ideas into agile, global solutions by designing and implementing scalable solutions. One … The post Streaming Real-Time Analytics with Redis, AWS Fargate, and Dash Framework appeared first on Uber Engineering Blog.
Grail needs to support security data as well as business analytics data and use cases. With that in mind, Grail needs to achieve three main goals with minimal impact to cost: Cope with and manage an enormous amount of data —both on ingest and analytics. High-performance analytics—no indexing required.
Customers can also proactively address issues using Davis AI’s predictive analytics capabilities by analyzing network log content, such as retries or anomalies in performance response times. Dynatrace natively supports Syslog using ActiveGate (preferred method) or the OpenTelemetry (OTel) collector.
Our guide covers AI for effective DevSecOps, converging observability and security, and cybersecurity analytics for threat detection and response. A unified observability and security analytics strategy can guide organizations toward a more proactive security posture at scale. Discover more insights from the 2024 CISO Report.
Simpler UI Testing with CasperJS ( Architects Zone – Architectural Design Patterns & Best Practices). Using MongoDB as a cache store ( Architects Zone – Architectural Design Patterns & Best Practices). Google Analytics Becomes A Robust Testing Platform With Content Experiments API ( Google Analytics Blog).
We organize all of the trending information in your field so you don't have to. Join 5,000+ users and stay up to date on the latest articles your peers are reading.
You know about us, now we want to get to know you!
Let's personalize your content
Let's get even more personalized
We recognize your account from another site in our network, please click 'Send Email' below to continue with verifying your account and setting a password.


Let's personalize your content