This site uses cookies to improve your experience. To help us insure we adhere to various privacy regulations, please select your country/region of residence. If you do not select a country, we will assume you are from the United States. Select your Cookie Settings or view our Privacy Policy and Terms of Use.
Cookie Settings
Cookies and similar technologies are used on this website for proper function of the website, for tracking performance analytics and for marketing purposes. We and some of our third-party providers may use cookie data for various purposes. Please review the cookie settings below and choose your preference.
Used for the proper function of the website
Used for monitoring website traffic and interactions
Cookie Settings
Cookies and similar technologies are used on this website for proper function of the website, for tracking performance analytics and for marketing purposes. We and some of our third-party providers may use cookie data for various purposes. Please review the cookie settings below and choose your preference.
Strictly Necessary: Used for the proper function of the website
Performance/Analytics: Used for monitoring website traffic and interactions
As cloud complexity increases and security concerns mount, organizations need log analytics to discover and investigate issues and gain critical business intelligence. But exploring the breadth of log analytics scenarios with most log vendors often results in unexpectedly high monthly log bills and aggressive year-over-year costs.
Leverage AI for proactive protection: AI and contextual analytics are game changers, automating the detection, prevention, and response to threats in real time. In dynamic and distributed cloud environments, the process of identifying incidents and understanding the material impact is beyond human ability to manage efficiently.
Metadata enrichment improves collaboration and increases analytic value. The Dynatrace® platform continues to increase the value of your data — broadening and simplifying real-time access, enriching context, and delivering insightful, AI-augmented analytics. Our Business Analytics solution is a prominent beneficiary of this commitment.
In this blog post, we will see how Dynatrace harnesses the power of observability and analytics to tailor a new experience to easily extend to the left, allowing developers to solve issues faster, build more efficient software, and ultimately improve developer experience!
As a result, organizations are implementing security analytics to manage risk and improve DevSecOps efficiency. Fortunately, CISOs can use security analytics to improve visibility of complex environments and enable proactive protection. What is security analytics? Why is security analytics important?
Scale with confidence: Leverage AI for instant insights and preventive operations Using Dynatrace, Operations, SRE, and DevOps teams can scale efficiently while maintaining software quality and ensuring security and reliability. AI-driven analytics transform data analysis, making it faster and easier to uncover insights and act.
Key benefits of Runtime Vulnerability Analytics Managing application vulnerabilities is no small feat. Unified vulnerabilities view The new Dynatrace platform consolidates third-party and code-level vulnerabilities into a single, intuitive view. By focusing on actionable intelligence, you can reduce noise and focus on whats important.
They now use modern observability to monitor expanding cloud environments in order to operate more efficiently, innovate faster and more securely, and to deliver consistently better business results. In what follows, we explore some key cloud observability trends in 2023, such as workflow automation and exploratory analytics.
But to be scalable, they also need low-code/no-code solutions that don’t require a lot of spin-up or engineering expertise. With the Dynatrace modern observability platform, teams can now use intuitive, low-code/no-code toolsets and causal AI to extend answer-driven automation for business, development and security workflows.
Code changes are often required to refine observability data. This results in site reliability engineers nudging development teams to add resource attributes, endpoints, and tokens to their source code. The missed SLO can be analytically explored and improved using Davis insights on an out-of-the-box Kubernetes workload overview.
By following key log analytics and log management best practices, teams can get more business value from their data. Challenges driving the need for log analytics and log management best practices As organizations undergo digital transformation and adopt more cloud computing techniques, data volume is proliferating.
Part of the problem is technologies like cloud computing, microservices, and containerization have added layers of complexity into the mix, making it significantly more challenging to monitor and secure applications efficiently. Learn more about how you can consolidate your IT tools and visibility to drive efficiency and enable your teams.
Log monitoring, log analysis, and log analytics are more important than ever as organizations adopt more cloud-native technologies, containers, and microservices-based architectures. What is log analytics? Log analytics is the process of evaluating and interpreting log data so teams can quickly detect and resolve issues.
Azure observability and Azure data analytics are critical requirements amid the deluge of data in Azure cloud computing environments. As digital transformation accelerates and more organizations are migrating workloads to Azure and other cloud environments, they need observability and data analytics capabilities that can keep pace.
In today’s data-driven world, businesses across various industry verticals increasingly leverage the Internet of Things (IoT) to drive efficiency and innovation. Mining and public transportation organizations commonly rely on IoT to monitor vehicle status and performance and ensure fuel efficiency and operational safety.
As a result, organizations need software to work perfectly to create customer experiences, deliver innovation, and generate operational efficiency. IT pros want a data and analytics solution that doesn’t require tradeoffs between speed, scale, and cost. The next frontier: Data and analytics-centric software intelligence.
What is log analytics? Log analytics is the process of viewing, interpreting, and querying log data so developers and IT teams can quickly detect and resolve application and system issues. In what follows, we explore log analytics benefits and challenges, as well as a modern observability approach to log analytics.
What is log analytics? Log analytics is the process of viewing, interpreting, and querying log data so developers and IT teams can quickly detect and resolve application and system issues. In what follows, we explore log analytics benefits and challenges, as well as a modern observability approach to log analytics.
Fast and efficient log analysis is critical in todays data-driven IT environments. For enterprises managing complex systems and vast datasets using traditional log management tools, finding specific log entries quickly and efficiently can feel like searching for a needle in a haystack.
Here’s how Dynatrace can help automate up to 80% of technical tasks required to manage compliance and resilience: Understand the complexity of IT systems in real time Proactively prevent, prioritize, and efficiently manage performance and security incidents Automate manual and routine tasks to increase your productivity 1.
This leads to a more efficient and streamlined experience for users. Lastly, monitoring and maintaining system health within a virtual environment, which includes efficient troubleshooting and issue resolution, can pose a significant challenge for IT teams. Instead, they interact with the applications that are hosted on Hyper-V.
With unified observability and security, organizations can protect their data and avoid tool sprawl with a single platform that delivers AI-driven analytics and intelligent automation. Grail handles data storage, data management, and processes data at massive speed, scale, and cost efficiency,” Singh said.
Theyre often categorized by their function; core processes directly create customer value, support processes increase departmental efficiency, and management processes drive strategic goals and compliance. Log files and APIs are the most common business data sources, and software agents may offer a simpler no-code option.
This growth was spurred by mobile ecosystems with Android and iOS operating systems, where ARM has a unique advantage in energy efficiency while offering high performance. Energy efficiency and carbon footprint outshine x86 architectures The first clear benefit of ARM in the enterprise IT landscape is energy efficiency.
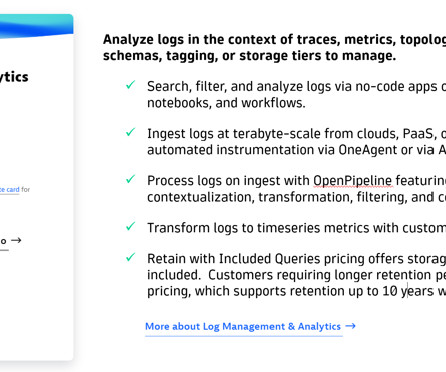
Grail combines the big-data storage of a data warehouse with the analytical flexibility of a data lake. With Grail, we have reinvented analytics for converged observability and security data,” Greifeneder says. Logs on Grail Log data is foundational for any IT analytics. Grail and DQL will give you new superpowers.”
By putting data in context, OpenPipeline enables the Dynatrace platform to deliver AI-driven insights, analytics, and automation for customers across observability, security, software lifecycle, and business domains. This “data in context” feeds Davis® AI, the Dynatrace hypermodal AI , and enables schema-less and index-free analytics.
Broken Apache Struts 2: Technical Deep Dive into CVE-2024-53677The vulnerability allows attackers to manipulate file upload parameters, possibly leading to remote code execution. This allows attackers to manipulate file upload parameters, leading to unauthorized file placement and potentially remote code execution (RCE).
In what follows, we define software automation as well as software analytics and outline their importance. What is software analytics? This involves big data analytics and applying advanced AI and machine learning techniques, such as causal AI. We also discuss the role of AI for IT operations (AIOps) and more. Operations.
These traditional approaches to log monitoring and log analytics thwart IT teams’ goal to address infrastructure performance problems, security threats, and user experience issues. Data variety is a critical issue in log management and log analytics. where an error occurred at the code level.
Business and technology leaders are increasing their investments in AI to achieve business goals and improve operational efficiency. From generating new code and boosting developer productivity to finding the root cause of performance issues with ease, the benefits of AI are numerous.
By leveraging Dynatrace observability on Red Hat OpenShift running on Linux, you can accelerate modernization to hybrid cloud and increase operational efficiencies with greater visibility across the full stack from hardware through application processes.
Last year, organizations prioritized efficiency and cost reduction while facing soaring inflation. 2: AI-generated code will create the need for digital immune systems. In 2024, more organizations will experience major digital service outages due to poor-quality and insufficiently supervised software code.
Grail needs to support security data as well as business analytics data and use cases. With that in mind, Grail needs to achieve three main goals with minimal impact to cost: Cope with and manage an enormous amount of data —both on ingest and analytics. High-performance analytics—no indexing required.
Statistical analysis and mining of huge multi-terabyte data sets is a common task nowadays, especially in the areas like web analytics and Internet advertising. This approach often leads to heavyweight high-latency analytical processes and poor applicability to realtime use cases. This technique is shown in the code snippet below.
While data lakes and data warehousing architectures are commonly used modes for storing and analyzing data, a data lakehouse is an efficient third way to store and analyze data that unifies the two architectures while preserving the benefits of both. Support diverse analytics workloads. What is a data lakehouse? Reduced redundancy.
While logging is the act of recording logs, organizations extract actionable insights from these logs with log monitoring, log analytics, and log management. Comparing log monitoring, log analytics, and log management. It is common to refer to these together as log management and analytics.
Our guide covers AI for effective DevSecOps, converging observability and security, and cybersecurity analytics for threat detection and response. AI is also crucial for securing data privacy, as it can more efficiently detect patterns, anomalies, and indicators of compromise. Learn more in this blog.
Indeed, according to one survey, DevOps practices have led to 60% of developers releasing code twice as quickly. But increased speed creates a tradeoff: According to another study, nearly half of organizations consciously deploy vulnerable code because of time pressure. Increased adoption of Infrastructure as code (IaC).
A modern observability and analytics platform brings data silos together and facilitates collaboration and better decision-making among teams. With a data lakehouse, DevSecOps teams can aggregate, store, and centralize structured and unstructured data in one cost-efficient repository without predetermining which data is necessary.
This blog explores how vertically integrated risk management solutions that use AI and automation enable unparalleled visibility, control, and efficiency for risk management in banking. They can accomplish this all while delivering transformation efficiency and economies of scale for IT functions that maintain risk management infrastructure.
Centralization of platform capabilities improves efficiency of managing complex, multi-cluster infrastructure environments According to research findings from the 2023 State of DevOps Report , “36% of organizations believe that their team would perform better if it was more centralized.” All this can be self-defined in the source code.
Business processes are important because they improve the efficiency, consistency, and quality of the business outcome. Business process monitoring helps organizations: Increase efficiency by identifying and addressing bottlenecks or inefficiencies that may slow down a business process. Reduce costs.
Dynatrace advanced observability – Dynatrace goes beyond m etrics, logs and traces are important to provide distributed tracing, code-level detail on entity relationships and topology, as well as user experience and behavior data that agencies need to take command of their dynamic?hybrid hybrid and?multi multi – cloud?
And now, it has become integral to organizations’ efforts to drive efficiency and improve productivity. As they continue on this path, organizations expect other benefits , from enabling business users to easily customize dashboards (54%) to building interactive queries for analytics (48%).
We organize all of the trending information in your field so you don't have to. Join 5,000+ users and stay up to date on the latest articles your peers are reading.
You know about us, now we want to get to know you!
Let's personalize your content
Let's get even more personalized
We recognize your account from another site in our network, please click 'Send Email' below to continue with verifying your account and setting a password.


Let's personalize your content