This site uses cookies to improve your experience. To help us insure we adhere to various privacy regulations, please select your country/region of residence. If you do not select a country, we will assume you are from the United States. Select your Cookie Settings or view our Privacy Policy and Terms of Use.
Cookie Settings
Cookies and similar technologies are used on this website for proper function of the website, for tracking performance analytics and for marketing purposes. We and some of our third-party providers may use cookie data for various purposes. Please review the cookie settings below and choose your preference.
Used for the proper function of the website
Used for monitoring website traffic and interactions
Cookie Settings
Cookies and similar technologies are used on this website for proper function of the website, for tracking performance analytics and for marketing purposes. We and some of our third-party providers may use cookie data for various purposes. Please review the cookie settings below and choose your preference.
Strictly Necessary: Used for the proper function of the website
Performance/Analytics: Used for monitoring website traffic and interactions
Azure observability and Azure data analytics are critical requirements amid the deluge of data in Azure cloud computing environments. Dynatrace recently announced the availability of its latest core innovations for customers running the Dynatrace® platform on Microsoft Azure, including Grail.
Introduction With big data streaming platform and event ingestion service Azure Event Hubs , millions of events can be received and processed in a single second. Any real-time analytics provider or batching/storage adaptor can transform and store data supplied to an event hub.
Dynatrace ® AutomationEngine features a no- and low-code toolset and leverages Davis ® AI to empower teams to create and extend customized, intelligent, and secure workflow automation across cloud ecosystems. For more details, see the blog post, Set up AI-powered observability for your Microsoft Azure cloud resources in just one click.
DevOps teams operating, maintaining, and troubleshooting Azure, AWS, GCP, or other cloud environments are provided with an app focused on their daily routines and tasks. This is explained in detail in our blog post, Unlock log analytics: Seamless insights without writing queries.
x runtime versions of Azure Functions running in an Azure App Service plan. This gives you deep visibility into your code running in Azure Functions, and, as a result, an understanding of its impact on overall application performance and user experience. Azure Functions in a nutshell. Simplify error analytics.
Log monitoring, log analysis, and log analytics are more important than ever as organizations adopt more cloud-native technologies, containers, and microservices-based architectures. Driving this growth is the increasing adoption of hyperscale cloud providers (AWS, Azure, and GCP) and containerized microservices running on Kubernetes.
Clearly, continuing to depend on siloed systems, disjointed monitoring tools, and manual analytics is no longer sustainable. This enables proactive changes such as resource autoscaling, traffic shifting, or preventative rollbacks of bad code deployment ahead of time.
What is Azure Functions? Similar to AWS Lambda , Azure Functions is a serverless compute service by Microsoft that can run code in response to predetermined events or conditions (triggers), such as an order arriving on an IoT system, or a specific queue receiving a new message. The growth of Azure cloud computing.
By following key log analytics and log management best practices, teams can get more business value from their data. Challenges driving the need for log analytics and log management best practices As organizations undergo digital transformation and adopt more cloud computing techniques, data volume is proliferating.
This is the second part of our blog series announcing the massive expansion of our Azure services support. Part 1 of this blog series looks at some of the key benefits of Azure DB for PostgreSQL, Azure SQL Managed Instance, and Azure HDInsight. Fully automated observability into your Azure multi-cloud environment.
x runtime versions of Azure Functions running in an Azure App Service plan. This gives you deep visibility into your code running in Azure Functions, and, as a result, an understanding of its impact on overall application performance and user experience. Azure Functions in a nutshell. Simplify error analytics.
For example, a segment for Service Errors in Azure Region can be applied instantly by selecting it from the dropdown. For example, the Service Errors in Azure Region segments can provide a dynamic list of available regions instead of creating multiple fixed region segments.
Hopefully, this blog will explain ‘why,’ and how Microsoft’s Azure Monitor is complementary to that of Dynatrace. Do I need more than Azure Monitor? Azure Monitor features. Application Insights – Collects performance metrics of the application code. Available as an agent installer). Hybrid and multi-cloud platform –.
Technical complexity has shifted from the actual code to the interdependencies between services. In 2006, Dynatrace released the first production-ready solution for distributed tracing with code-level insights. FaaS like AWS Lambda and Azure Functions are seamlessly integrated with no code changes.
By putting data in context, OpenPipeline enables the Dynatrace platform to deliver AI-driven insights, analytics, and automation for customers across observability, security, software lifecycle, and business domains. This “data in context” feeds Davis® AI, the Dynatrace hypermodal AI , and enables schema-less and index-free analytics.
Leveraging cloud-native technologies like Kubernetes or Red Hat OpenShift in multicloud ecosystems across Amazon Web Services (AWS) , Microsoft Azure, and Google Cloud Platform (GCP) for faster digital transformation introduces a whole host of challenges. Dynatrace news. Manually maintaining dependencies among components doesn’t scale.
To make this possible, the application code should be instrumented with telemetry data for deep insights, including: Metrics to find out how the behavior of a system has changed over time. Similarly, integrations for Azure and VMware are available to help you monitor your infrastructure both in the cloud and on-premises. Conclusion.
These functions are executed by a serverless platform or provider (such as AWS Lambda, Azure Functions or Google Cloud Functions) that manages the underlying infrastructure, scaling and billing. and GoLang to reduce the necessary boilerplate code to a minimum. Such anomalies can be caused by function cold-starts.
The result is a framework that offers a single source of truth and enables companies to make the most of advanced analytics capabilities simultaneously. Data lakehouses take advantage of low-cost object stores like AWS S3 or Microsoft Azure Blob Storage to store and manage data cost-effectively. Support diverse analytics workloads.
For those who aspire to become power users, the new in-app DQL editor (Dynatrace Query Language) translates manually selected filters into the DQL code executed in the backend. Only Dynatrace provides a comprehensive and accessible log management and analytics experience, helping teams resolve issues faster without compromising on depth.
As a result, teams can focus on writing code and building features rather than dealing with infrastructure nuances. They shouldn’t worry about the platform; they should just start writing code.” “You can launch a code space that starts a container that shows you everything about how an app was built and deployed.”
OpenTelemetry works by providing developers with APIs, SDKs, and tools to instrument their code and collect telemetry data such as logs, metrics, and traces. Challenges of adopting OpenTelemetry The first challenge is that OpenTelemetry only gathers and processes data—it has no back end, no storage, and no analytics.
Impact : This issue affects only those extensions that use native libraries called from Python code distributed with the extension. New analytics view for message queues. Azure VMs that are monitoring candidates are now labeled “no OneAgent” on the Azure region and scale set pages. (APM-323431). APM-333310).
Business analytics : Organizations can combine business context with full stack application analytics and performance to understand real-time business impact, improve conversion optimization, ensure that software releases meet expected business goals, and confirm that the organization is adhering to internal and external SLAs.
Developer tools for building container images : Docker Build creates a container image, the blueprint for a container, including everything needed to run an application – the application code, binaries, scripts, dependencies, configuration, environment variables, and so on. Here are some examples.
And how can you verify this performance consistently across a multicloud environment that also uses Microsoft Azure and Google Cloud Platform frameworks? This is where unified observability and Dynatrace Automations can help by leveraging causal AI and analytics to drive intelligent automation across your multicloud ecosystem.
Build a custom pipeline observability solution With these challenges in mind, Omnilogy set out to simplify CI/CD analytics across different vendors, streamlining performance management for critical builds. Consequently, troubleshooting issues and ensuring seamless software deployment becomes increasingly tricky.
Besides real user analytics, we also use Dynatrace Synthetic Monitoring , which continuously validates successful logins to our SaaS tenants on each cluster. Those tests get executed from two locations (Paris and London) hosted by different cloud vendors (Azure & AWS). Fact #3: Minimum impact detected through synthetics.
To make this possible, the application code should be instrumented with telemetry data for deep insights , includin g: . Dynatrace is the only monitoring solution that provides observability (with no code changes) into every layer of your Kubernetes deployment , including your cloud infrastructure provider. .
Enterprise data stores grow with the promise of analytics and the use of data to enable behavioral security solutions, cognitive analytics, and monitoring and supervision. Log4j is a ubiquitous software code in various consumer-facing products and services.
Additionally, PurePath provides distributed tracing with code-level detail at scale with contextual data. American Family deployed this IAM role through the code pipeline to all existing AWS accounts. Dynatrace OneAgent provides automatic full-stack data capture for dynamic multicloud environments.
Therefore, we implemented Dynatrace in almost all major applications for our customers to gain visibility from end-user to code-level and to reduce time with problem fixing and pro-active scalability optimizations by using Dynatrace’s AI-based root cause analysis. Our customers usually involve us 2-4 weeks before the production release.
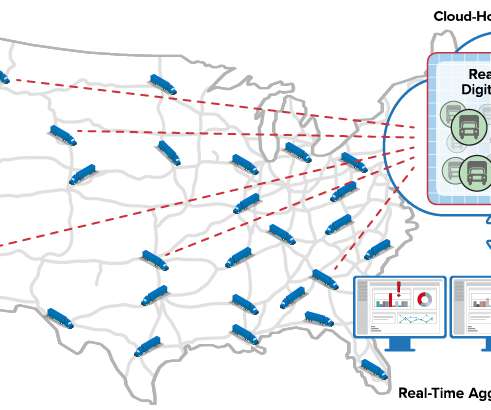
Whether it’s health-tracking watches, long-haul trucks, or security sensors, extracting value from these devices requires streaming analytics that can quickly make sense of the telemetry and intelligently react to handle an emerging issue or capture a new opportunity.
Observability-driven development Yarden Laifenfeld, senior software engineer at Dynatrace, presented the first use case for the software development lifecycle (SDLC): observability-driven development, which is the process of integrating observability and security before the first line of code is even written.
And how are they different from streaming pipelines like Azure Stream Analytics and Apache Flink/Beam? What Problems Does Streaming Analytics Solve? To understand why we need real-time digital twins for streaming analytics, we first need to look at what problems are tackled by popular streaming platforms.
Cloud application security practices enable organizations to follow secure coding practices, monitor and log activities for detection and response, comply with regulations, and develop incident response plans. It also entails secure development practices, security monitoring and logging, compliance and governance, and incident response.
End-to-end code-level tracing. Cluster and container Log Analytics. Dynatrace’s PurePath technology brings us automatic end-to-end code level tracing without having to modify any code or configuration. MaaS for Developers: Understand and optimize your code. 2: Distributed code optimization.
With AIOps , practitioners can apply automation to IT operations processes to get to the heart of problems in their infrastructure, applications and code. Dynatrace extends contextual analytics and AIOps for open observability. Prevent poor-quality code changes from affecting end users. 9 key DevOps metrics for success.
Open source databases are free community databases with the source code available to the general public to use, and may be modified or used in their original design. with a surprising lead over Azure at 10.8%. So, which databases are most popular in 2019? of all cloud deployments from this survey.
This leaves our last cloud provider – Microsoft Azure, who represented 3.2% This is one of the most shocking discoveries, as Azure was tied for second with GCP back in April, and is commonly a popular choice for enterprise organizations leveraging the Microsoft suite of services. of PostgreSQL hosting. On average, 21.7%
The next level of observability: OneAgent In the first two parts of our series, we used OpenTelemetry to manually instrument our application and send the telemetry data straight to the Dynatrace analytics back end. However, this method limited us to instrumenting the code manually and collecting specific sets of data we defined upfront.
Cloud-native architecture is a structural approach to planning and implementing an environment for software development and deployment that uses resources and processes common with public clouds like Amazon Web Services, Microsoft Azure, and Google Cloud Platform. This simplifies management and streamlines rollback, roll forward, and updates.
Bucketizing date and time data involves organizing data in groups representing fixed intervals of time for analytical purposes. One is using a function called DATE_BUCKET , which at the time of writing is only available in Azure SQL Edge. As mentioned, the DATE_BUCKET function is currently available only in Azure SQL Edge.
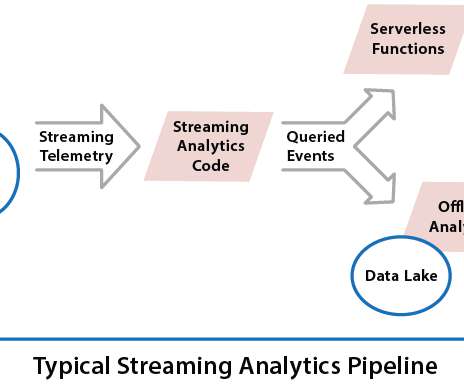
Consider the typical, conventional streaming analytics pipeline available on popular cloud platforms: A conventional pipeline combines telemetry from all data sources into a single stream which is queried by the user’s streaming analytics application. However, real-time digital twins easily bring these capabilities within reach.
We organize all of the trending information in your field so you don't have to. Join 5,000+ users and stay up to date on the latest articles your peers are reading.
You know about us, now we want to get to know you!
Let's personalize your content
Let's get even more personalized
We recognize your account from another site in our network, please click 'Send Email' below to continue with verifying your account and setting a password.


Let's personalize your content