This site uses cookies to improve your experience. To help us insure we adhere to various privacy regulations, please select your country/region of residence. If you do not select a country, we will assume you are from the United States. Select your Cookie Settings or view our Privacy Policy and Terms of Use.
Cookie Settings
Cookies and similar technologies are used on this website for proper function of the website, for tracking performance analytics and for marketing purposes. We and some of our third-party providers may use cookie data for various purposes. Please review the cookie settings below and choose your preference.
Used for the proper function of the website
Used for monitoring website traffic and interactions
Cookie Settings
Cookies and similar technologies are used on this website for proper function of the website, for tracking performance analytics and for marketing purposes. We and some of our third-party providers may use cookie data for various purposes. Please review the cookie settings below and choose your preference.
Strictly Necessary: Used for the proper function of the website
Performance/Analytics: Used for monitoring website traffic and interactions
This year’s AWS re:Invent will showcase a suite of new AWS and Dynatrace integrations designed to enhance cloud performance, security, and automation. These innovations promise to streamline operations, boost efficiency, and offer deeper insights for enterprises using AWS services.
Visibility into system activity and behavior has become increasingly critical given organizations’ widespread use of Amazon Web Services (AWS) and other serverless platforms. These resources generate vast amounts of data in various locations, including containers, which can be virtual and ephemeral, thus more difficult to monitor.
Log monitoring, log analysis, and log analytics are more important than ever as organizations adopt more cloud-native technologies, containers, and microservices-based architectures. Driving this growth is the increasing adoption of hyperscale cloud providers (AWS, Azure, and GCP) and containerized microservices running on Kubernetes.
The Dynatrace platform automatically captures and maps metrics, logs, traces, events, user experience data, and security signals into a single datastore, performing contextual analytics through a “power of three AI”—combining causal, predictive, and generative AI.
DevOps teams operating, maintaining, and troubleshooting Azure, AWS, GCP, or other cloud environments are provided with an app focused on their daily routines and tasks. This is explained in detail in our blog post, Unlock log analytics: Seamless insights without writing queries.
We’ve worked closely with our partner AWS to deliver a complete, end-to-end picture of your cloud environment that includes monitoring support for all AWS services. Now Dynatrace is pleased to announce another industry first: automatic, end-to-end observability for AWS Lambda functions in Node.js and Python via traces.
We’re excited to announce several log management innovations, including native support for Syslog messages, seamless integration with AWS Firehose, an agentless approach using Kubernetes Platform Monitoring solution with Fluent Bit, a new out-of-the-box ingest dashboard, and OpenPipeline ingest improvements.
AWS Lambda is the fastest growing technology for serverless workloads and helps developers innovate faster. Dynatrace stays on top with the latest improvements to AWS Lambda. The Dynatrace extension for AWS Lambda provides full visibility into AWS Lambda functions independent of the deployment method. Dynatrace news.
At the AWS re:Invent 2023 conference, generative AI is a centerpiece. In this AWS re:Invent 2023 guide, we explore the role of generative AI in the issues organizations face as they move to the cloud: IT automation, cloud migration and digital transformation, application security, and more. What is predictive AI? What is AIOps?
To continue down the carbon reduction path, IT leaders must drive carbon optimization initiatives into the hands of IT operations teams, arming them with the tools needed to support analytics and optimization. This is partly due to the complexity of instrumenting and analyzing emissions across diverse cloud and on-premises infrastructures.
Starting in May, selected customers will get to experience all the latest Dynatrace platform features, including the Grail data lakehouse, Davis AI, and unrivaled log analytics, on Google Cloud. The Infrastructure & Operations app provides an up-to-date and comprehensive view of monitored environments on Google Cloud.
Overseeing SaaS security and monitoring audit logs across multiple SaaS applications is complex, which often involves building and maintaining dedicated integrations for each application that can retrieve audit logs. Leckenby, senior director worldwide alliance sales at Dynatrace.
If you use AWS cloud services to build and run your applications, you may be familiar with the AWS Well-Architected framework. This is where unified observability and Dynatrace Automations can help by leveraging causal AI and analytics to drive intelligent automation across your multicloud ecosystem.
Following the launch of Dynatrace® Grail for Log Management and Analytics , we’re excited to announce a major update to our Business Analytics solution. Leveraging existing APM agent and log monitoring capabilities made it reasonably easy to access certain business metrics and metadata to add to IT dashboards.
AWS Distro for OpenTelemetry provides an easy way to obtain telemetry data for monitoring critical business applications that run on AWS. Here are the key advantages of using Dynatrace for AWS Distro for OpenTelemetry: . Ease of ingestion —with AWS Distro for OpenTelemetry .
With our enhanced AWS Lambda extension , we bring the power of Dynatrace PurePath 4 automatic tracing technology to serverless function observability. unique capabilities of the enhanced AWS Lambda extension include: An end-to-end distributed tracing view with full visibility?across Actionable analytics across the?entire
Using various tools to monitor services running across hybrid/multicloud environments, with each tool requiring its own expertise. Unlike other competitors in the market, the Dynatrace Software Intelligence Platform is purpose-built for dynamic enterprise cloud environments such as AWS, with full automation and AI at the core.
Many AWS services and third party solutions use AWS S3 for log storage. We hear from our customers how important it is to have a centralized, quick, and powerful access point to analyze these logs; hence we’re making it easier to ingest AWS S3 logs and leverage Dynatrace Log Management and Analytics powered by Grail.
Simplified collaboration Individual users and teams can share segments to ensure consistent filtering logic across apps, dashboards, or even business analytics use cases. AWS region: Using a variable, you can dynamically limit the scope to AWS regions selected from the dropdown. Watch this scenario in action.
We’re therefore excited to see that AWS has adopted the OpenTelemetry standards, which are actively driven by Dynatrace and the largest cloud providers. What is AWS Distro for OpenTelemetry? It has undergone security analysis and testing in accordance with AWS requirements. Dynatrace drives and embraces open standards.
Digital transformation with AWS: Making it real with AIOps. When Amazon launched AWS Lambda in 2014, it ushered in a new era of serverless computing. Amazon Web Services (AWS) and other cloud platforms provide visibility into their own systems, but they leave a gap concerning other clouds, technologies, and on-prem resources.
We’re excited to announce that Dynatrace has been recognized as a launch partner for the newly introduced Amazon Web Services (AWS) offering AWS Lambda Function URLs. What is AWS Lambda? AWS Lambda is one of the most popular serverless compute services in the market. What are AWS Lambda Function URLs.
Dynatrace is proud to be an AWS launch partner in support of Amazon Lambda SnapStart. For AWS Lambda, the largest contributor to startup latency is the time spent initializing an execution environment, which includes loading function code and initializing dependencies. Simplify error analytics. How does Dynatrace help?
Dynatrace is a launch partner in support of AWS Lambda Response Streaming , a new capability enabling customers to improve the efficiency and performance of their Lambda functions. This enhancement allows AWS users to stream response payloads back to clients. To learn more about the AWS Lambda features, visit the Lamba features page.
Kubernetes (k8s) provides basic monitoring through the Kubernetes API and you can find instructions like Top 9 Open Source Tools for Monitoring Kubernetes as a “do it yourself guide”. Cluster and container Log Analytics. End-user monitoring. AWS EKS for Integration and Production. Dynatrace news. REDIS for caching.
In this blog post, we’ll use Dynatrace Security Analytics to go threat hunting, bringing together logs, traces, metrics, and, crucially, threat alerts. Likewise, operation specialists can prioritize their efforts on monitoring the highest-risk tactics, and executives can better communicate the business risk.
Real-time streaming needs real-time analytics As enterprises move their workloads to cloud service providers like Amazon Web Services, the complexity of observing their workloads increases. Amazon CloudWatch is the most common method of collecting logs across your AWS footprint. First, you need to generate an API key to ingest logs.
Monitor your cloud OpenPipeline ™ is the Dynatrace platform data-handling solution designed to seamlessly ingest and process data from any source, regardless of scale or format. Seamless integration with AWS Data Firehose: address high-impact issues quickly through real-time, high-frequency log analytics.
Dynatrace has added support for the newly introduced Amazon Virtual Private Cloud (VPC) Flow Logs for AWS Transit Gateway. What is AWS Transit Gateway? AWS Transit Gateway is a service offering from Amazon Web Services that connects network resources via a centralized hub. Check out our Power Demo: Log Analytics with Dynatrace.
Versatile, feature-rich cloud computing environments such as AWS, Microsoft Azure, and GCP have been a game-changer. Cloud computing environments like AWS, Azure, and GCP offer a wide array of computing capabilities and capacity. They need a platform-agnostic way to monitor and manage performance across all of them seamlessly.
As organizations plan, migrate, transform, and operate their workloads on AWS, it’s vital that they follow a consistent approach to evaluating both the on-premises architecture and the upcoming design for cloud-based architecture. AWS 5-pillars. Dynatrace and AWS. through our AWS integrations and monitoring support.
Methods include the observability capabilities of the platforms their applications run on; monitoring tools, OpenTelemetry, OpenTracing, OpenMonitor, OpenCensus, Jaeger, Zipkin, Log, CloudWatch, and more. Just one command instruments your entire application environment for monitoring. Automatic topology analysis.
Observability and monitoring as a source of truth. To provide actionable answers monitoring systems store, baseline, and analyze telemetry data. Dynatrace is the only monitoring solution that provides observability (with no code changes) into every layer of your Kubernetes deployment, including your cloud infrastructure provider.
June 6, 2019 – ScaleGrid , the Database-as-a-Service (DBaaS) leader in the SQL and NoSQL space, has announced the expansion of their fully managed MySQL Hosting services to support Amazon Web Services (AWS) cloud. PALO ALTO, Calif., Start a free MySQL trial to see how ScaleGrid can help you optimize your deployments.
AWS offers a broad set of global, cloud-based services including computing, storage, networking, Internet of Things (IoT), and many others. At Dynatrace, we’re constantly improving our AWSmonitoring capabilities. Monitor and understand additional AWS services. Get up to 300 new AWS metrics out of the box.
Notable breaches, such as the Capital One data breach, have demonstrated the severe impact of SSRF, where attackers exploited an SSRF vulnerability to access AWS metadata and gain privileged access.
Despite its benefits, serverless computing introduces additional monitoring challenges for developers and IT Operations, particularly in understanding dependencies and identifying issues in the end-to-end traces that flow through a complex mix of dynamic and hybrid on-premise/cloud environments. Simplify error analytics. So stay tuned!
AWS offers a broad set of global, cloud-based services including computing, storage, networking, Internet of Things (IoT), and many others. At Dynatrace, we’re constantly improving our AWSmonitoring capabilities. Monitor and understand additional AWS services. Get up to 300 new AWS metrics out of the box.
Next-gen Infrastructure Monitoring. Next up, Steve introduced enhancements to our infrastructure monitoring module. Davis now automatically provides thresholds and baselining algorithms for all infrastructure performance and reliability metrics to easily scale infrastructure monitoring without manual configuration.
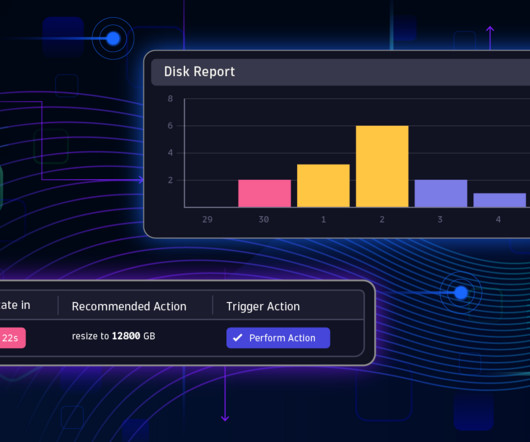
Automate disk resizing operations with Davis AI predictive analytics The Dynatrace Site Reliability Engineering (SRE) team was looking for a way to automatically adjust disk space for cloud volumes on a regular basis to avoid over- or under-provisioning them. Figure 3: Funnel analysis implemented by selecting a custom user journey.
Challenges The cloud network infrastructure that Netflix utilizes today consists of AWS services such as VPC, DirectConnect, VPC Peering, Transit Gateways, NAT Gateways, etc and Netflix owned devices. Without having network visibility, it’s difficult to improve our reliability, security and capacity posture.
Leveraging cloud-native technologies like Kubernetes or Red Hat OpenShift in multicloud ecosystems across Amazon Web Services (AWS) , Microsoft Azure, and Google Cloud Platform (GCP) for faster digital transformation introduces a whole host of challenges. Dynatrace news. Connecting data siloes requires daunting integration endeavors.
Unified observability and security When the company’s expanding portfolio and digital-first innovation began transforming how it went to market, the energy leader made the investment to migrate legacy applications to the Amazon Web Services (AWS) cloud.
In November 2015, Amazon Web Services announced that it would launch a new AWS infrastructure region in the United Kingdom. Today, I'm happy to announce that the AWS Europe (London) Region, our 16th technology infrastructure region globally, is now generally available for use by customers worldwide.
We organize all of the trending information in your field so you don't have to. Join 5,000+ users and stay up to date on the latest articles your peers are reading.
You know about us, now we want to get to know you!
Let's personalize your content
Let's get even more personalized
We recognize your account from another site in our network, please click 'Send Email' below to continue with verifying your account and setting a password.


Let's personalize your content