This site uses cookies to improve your experience. To help us insure we adhere to various privacy regulations, please select your country/region of residence. If you do not select a country, we will assume you are from the United States. Select your Cookie Settings or view our Privacy Policy and Terms of Use.
Cookie Settings
Cookies and similar technologies are used on this website for proper function of the website, for tracking performance analytics and for marketing purposes. We and some of our third-party providers may use cookie data for various purposes. Please review the cookie settings below and choose your preference.
Used for the proper function of the website
Used for monitoring website traffic and interactions
Cookie Settings
Cookies and similar technologies are used on this website for proper function of the website, for tracking performance analytics and for marketing purposes. We and some of our third-party providers may use cookie data for various purposes. Please review the cookie settings below and choose your preference.
Strictly Necessary: Used for the proper function of the website
Performance/Analytics: Used for monitoring website traffic and interactions
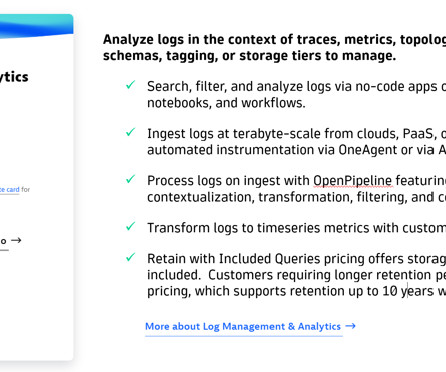
As cloud complexity increases and security concerns mount, organizations need log analytics to discover and investigate issues and gain critical business intelligence. But exploring the breadth of log analytics scenarios with most log vendors often results in unexpectedly high monthly log bills and aggressive year-over-year costs.
This article is the first in a multi-part series sharing a breadth of Analytics Engineering work at Netflix, recently presented as part of our annual internal Analytics Engineering conference. Subsequent posts will detail examples of exciting analytic engineering domain applications and aspects of the technical craft.
This article is the second in a multi-part series sharing a breadth of Analytics Engineering work at Netflix, recently presented as part of our annual internal Analytics Engineering conference. With ASR, and other new and enhanced technologies we introduce, rigorous analytics and measurement are essential to their success.
Metadata enrichment improves collaboration and increases analytic value. The Dynatrace® platform continues to increase the value of your data — broadening and simplifying real-time access, enriching context, and delivering insightful, AI-augmented analytics. Our Business Analytics solution is a prominent beneficiary of this commitment.
As a result, organizations are implementing security analytics to manage risk and improve DevSecOps efficiency. Fortunately, CISOs can use security analytics to improve visibility of complex environments and enable proactive protection. What is security analytics? Why is security analytics important? Here’s how.
Boost your operational resilience: Combining availability and security is now essential. Leverage AI for proactive protection: AI and contextual analytics are game changers, automating the detection, prevention, and response to threats in real time. No more manually piecing together data sources for security analytics.
Its AI-driven exploratory analytics help organizations navigate modern software deployment complexities, quickly identify issues before they arise, shorten remediation journeys, and enable preventive operations. AI-driven analytics transform data analysis, making it faster and easier to uncover insights and act.
The Clouds app provides a view of all available cloud-native services. Logs in context, along with other details, are instantly available after selecting a resource. This is explained in detail in our blog post, Unlock log analytics: Seamless insights without writing queries.
The market demands a robust solution that can monitor applications and the underlying network infrastructure to ensure end-to-end availability and performance. The Dynatrace approach Dynatrace addresses these challenges by extending its synthetic monitoring capabilities to include Network Availability Monitoring.
This is where observability analytics can help. What is observability analytics? Observability analytics enables users to gain new insights into traditional telemetry data such as logs, metrics, and traces by allowing users to dynamically query any data captured and to deliver actionable insights. Put simply, context is king.
Second, embracing the complexity of OpenTelemetry signal collection must come with a guaranteed payoff: gaining analytical insights and causal relationships that improve business performance. The missed SLO can be analytically explored and improved using Davis insights on an out-of-the-box Kubernetes workload overview.
Exploratory analytics with collaborative analytics capabilities can be a lifeline for CloudOps, ITOps, site reliability engineering, and other teams struggling to access, analyze, and conquer the never-ending deluge of big data. These analytics can help teams understand the stories hidden within the data and share valuable insights.
By following key log analytics and log management best practices, teams can get more business value from their data. Challenges driving the need for log analytics and log management best practices As organizations undergo digital transformation and adopt more cloud computing techniques, data volume is proliferating.
Dynatrace automatically puts logs into context Dynatrace Log Management and Analytics directly addresses these challenges. Log analytics simplified: Deeper insights, no DQL required Your team will immediately notice the streamlined log analysis capabilities below the histogram. This context is vital to understanding issues.
Information related to user experience, transaction parameters, and business process parameters has been an unretrieved treasure, now accessible through new and unique AI-powered contextual analytics in Dynatrace. Executives drive business growth through strategic decisions, relying on data analytics for crucial insights.
Streamlining observability with Dynatrace OneAgent on AWS Image Builder In our ongoing collaboration with AWS, we’re excited to make the Dynatrace OneAgent available as a first-class integration on AWS Image Builder via the AWS Marketplace.
Exploratory analytics now cover more bespoke scenarios, allowing you to access any element of test results stored in the Dynatrace Grail data lakehouse. Thanks to the power of Grail, those details are available for all executions stored for the entire retention period during which synthetic results are kept.
Following the launch of Dynatrace® Grail for Log Management and Analytics , we’re excited to announce a major update to our Business Analytics solution. It represents a significant enhancement to our previous Business Analytics capabilities, which emphasized the value and simplicity of business data captured from real user sessions.
Log management and analytics is an essential part of any organization’s infrastructure, and it’s no secret the industry has suffered from a shortage of innovation for several years. Limited data availability constrains value creation. Even in cases where all data is available, new challenges can arise. Create filters.
The application consists of several microservices that are available as pod-backed services. This gives us unified analytics views of node resources together with pod-level metrics such as container CPU throttling by node, which makes problem correlation much easier to analyze. The following example drives the point home.
Increasingly, organizations seek to address these problems using AI techniques as part of their exploratory data analytics practices. The next challenge is harnessing additional AI techniques to make exploratory data analytics even easier. Start by asking yourself what’s there, whether it’s logs, metrics, or traces.
Dynatrace and Microsoft extend leading observability and log analytics With the daunting amount of data enterprises must manage in the cloud, it’s become clear that observability is no longer optional. By prioritizing observability, organizations can ensure the availability, performance, and security of business-critical applications.
Grail – the foundation of exploratory analytics Grail can already store and process log and business events. Let Grail do the work, and benefit from instant visualization, precise analytics in context, and spot-on predictive analytics. You no longer need to split, distribute, or pre-aggregate your data.
This information is essential for later advanced analytics and aircraft tracking. They provide detailed information that, when sent to Dynatrace, enables data analytics and improved decision-making capabilities. Some outputs can be displayed as single values, categorical charts, line charts, or other dashboard elements, as shown below.
Log monitoring, log analysis, and log analytics are more important than ever as organizations adopt more cloud-native technologies, containers, and microservices-based architectures. What is log analytics? Log analytics is the process of evaluating and interpreting log data so teams can quickly detect and resolve issues.
To continue down the carbon reduction path, IT leaders must drive carbon optimization initiatives into the hands of IT operations teams, arming them with the tools needed to support analytics and optimization. The certification results are now publicly available. Today, Carbon Impact has a new name: Cost & Carbon Optimization.
Azure observability and Azure data analytics are critical requirements amid the deluge of data in Azure cloud computing environments. As digital transformation accelerates and more organizations are migrating workloads to Azure and other cloud environments, they need observability and data analytics capabilities that can keep pace.
Business analytics is a growing science that’s rising to meet the demands of data-driven decision making within enterprises. But what is business analytics exactly, and how can you feed it with reliable data that ties IT metrics to business outcomes? What is business analytics? Why business analytics matter.
With extended contextual analytics and AIOps for open observability, Dynatrace now provides you with deep insights into every entity in your IT landscape, enabling you to seamlessly integrate metrics, logs, and traces—the three pillars of observability. Dynatrace extends its unique topology-based analytics and AIOps approach.
A traditional log-based SIEM approach to security analytics may have served organizations well in simpler on-premises environments. Security Analytics and automation deal with unknown-unknowns With Security Analytics, analysts can explore the unknown-unknowns, facilitating queries manually in an ad hoc way, or continuously using automation.
The end goal, of course, is to optimize the availability of organizations’ software. Dynatrace is widely recognized for its AI capabilities’ ability to predict and prevent issues, and automatically identify root causes, maximizing availability. Note that the work doesn’t get reduced. Want to learn more about all nine use cases?
With 99% of organizations using multicloud environments , effectively monitoring cloud operations with AI-driven analytics and automation is critical. IT operations analytics (ITOA) with artificial intelligence (AI) capabilities supports faster cloud deployment of digital products and services and trusted business insights.
The growing complexity of modern multicloud environments has created a pressing need to converge observability and security analytics. Security analytics is a discipline within IT security that focuses on proactive threat prevention using data analysis. Clair determined what log data was available to her. To begin, St.
In this blog post, we will see how Dynatrace harnesses the power of observability and analytics to tailor a new experience to easily extend to the left, allowing developers to solve issues faster, build more efficient software, and ultimately improve developer experience!
To stay competitive in an increasingly digital landscape, organizations seek easier access to business analytics data from IT to make better business decisions faster. Five constraints that limit insights from business analytics data. Digital businesses rely on real-time business analytics data to make agile decisions.
Thats why Dynatrace will make its AI-powered, unified observability platform generally available on Google Cloud for all customers later this year. Starting in May, selected customers will get to experience all the latest Dynatrace platform features, including the Grail data lakehouse, Davis AI, and unrivaled log analytics, on Google Cloud.
How do I connect the dots between mobile analytics and performance monitoring? Connect the dots between mobile analytics and performance monitoring with mobile business analytics. Connect the dots between mobile analytics and performance monitoring with mobile business analytics. Seeing is believing!
What is log analytics? Log analytics is the process of viewing, interpreting, and querying log data so developers and IT teams can quickly detect and resolve application and system issues. In what follows, we explore log analytics benefits and challenges, as well as a modern observability approach to log analytics.
What is log analytics? Log analytics is the process of viewing, interpreting, and querying log data so developers and IT teams can quickly detect and resolve application and system issues. In what follows, we explore log analytics benefits and challenges, as well as a modern observability approach to log analytics.
We’ve introduced brand-new analytics capabilities by building on top of existing features for messaging systems. You can easily switch between the available metrics as necessary, apply different aggregation functions, or define metric-specific alerts. Finally, you can configure and activate them there. New to Dynatrace?
The nirvana state of system uptime at peak loads is known as “five-nines availability.” In its pursuit, IT teams hover over system performance dashboards hoping their preparations will deliver five nines—or even four nines—availability. But is five nines availability attainable? Downtime per year. 90% (one nine).
Kickstart your creation journey using ready-made dashboards and notebooks Creating dashboards and notebooks from scratch can take time, particularly when figuring out available data and how to best use it. This feature lets you explore any available metric and add it to Notebooks or Dashboards.
Dynatrace Smartscape® technology provides all data in context to simplify analytics and problem detection by semantically mapping metrics, traces, logs, and real user data to specific Kubernetes objects, including containers, pods, nodes, and services. Dynatrace observability is available for Red Hat OpenShift on IBM Power.
Mobile analytics can help organizations optimize their mobile application performance, earning customer accolades and increasing revenue in the process. Learn how one Dynatrace customer leveraged mobile analytics to ensure a crash-free, five-star mobile application. Add instrumentation and validate incoming mobile analytics data.
We organize all of the trending information in your field so you don't have to. Join 5,000+ users and stay up to date on the latest articles your peers are reading.
You know about us, now we want to get to know you!
Let's personalize your content
Let's get even more personalized
We recognize your account from another site in our network, please click 'Send Email' below to continue with verifying your account and setting a password.


Let's personalize your content