This site uses cookies to improve your experience. To help us insure we adhere to various privacy regulations, please select your country/region of residence. If you do not select a country, we will assume you are from the United States. Select your Cookie Settings or view our Privacy Policy and Terms of Use.
Cookie Settings
Cookies and similar technologies are used on this website for proper function of the website, for tracking performance analytics and for marketing purposes. We and some of our third-party providers may use cookie data for various purposes. Please review the cookie settings below and choose your preference.
Used for the proper function of the website
Used for monitoring website traffic and interactions
Cookie Settings
Cookies and similar technologies are used on this website for proper function of the website, for tracking performance analytics and for marketing purposes. We and some of our third-party providers may use cookie data for various purposes. Please review the cookie settings below and choose your preference.
Strictly Necessary: Used for the proper function of the website
Performance/Analytics: Used for monitoring website traffic and interactions
Just one click to your preventive analysis. Dynatrace now goes a step further and makes it possible for SREs and DevOps to perform proactive exploratory analysis of observability signals with intelligent answers. With Davis exploratory analysis we can now automatically analyze thousands of signals before incidences even arise.
Dynatrace customers have the ability to leverage PurePath distributed tracing functionality in driving adhoc multidimensional analysis (MDA) on any kind of data available within their microservices. A larger financial institution is using the analysis to report business metrics on dashboards and make them accessible via the Dynatrace API.
How To Find Your Application’s GC Thread Count You can determine your application’s GC thread count by doing a thread dump analysis as outlined below: In this post, we will discuss why JVM can end up having too many/too few GC threads, the consequences of it, and potential solutions to address them.
Modern organizations ingest petabytes of data daily, but legacy approaches to log analysis and management cannot accommodate this volume of data. Traditional log analysis evaluates logs and enables organizations to mitigate myriad risks and meet compliance regulations. Grail enables 100% precision insights into all stored data.
A unified platform approach also makes OpenTelemetry data available to more teams across the organization for more diversified analysis. By automatically detecting these OpenTelemetry endpoints, Davis AI adds the endpoints to its service list for analysis and alerting with no additional setup or configuration required.
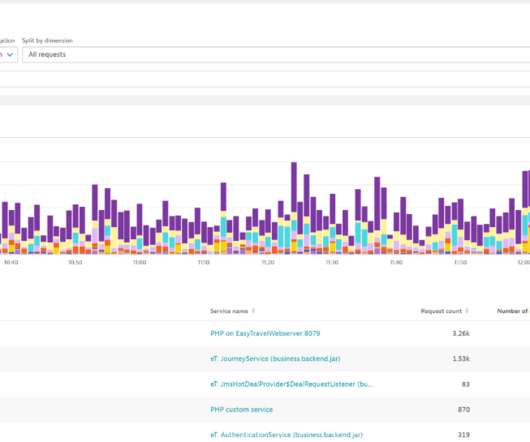
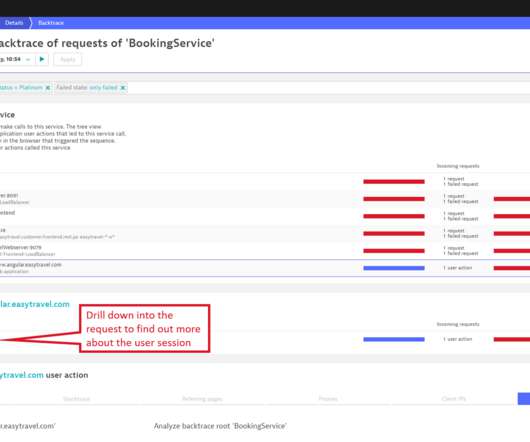
In Part 1 of this blog series , we presented a few Dynatrace customer use cases for multidimensional analysis. To start your analysis, select Diagnostic tools from the navigation menu and select Multidimensional analysis. To find out, select the Backtrace button at the top-right corner of the Failure analysis page (see below).
OpenTelemetry is enhancing GenAI observability : By defining semantic conventions for GenAI and implementing Python-based instrumentation for OpenAI, OpenTel is moving towards addressing GenAI monitoring and performance tuning needs. The Collector is expected to be ready for prime time in 2025, reaching the v1.0
Migrating Critical Traffic At Scale with No Downtime — Part 1 Shyam Gala , Javier Fernandez-Ivern , Anup Rokkam Pratap , Devang Shah Hundreds of millions of customers tune into Netflix every day, expecting an uninterrupted and immersive streaming experience. This technique facilitates validation on multiple fronts.
In my last post , I started to outline the process I go through when tuning queries – specifically when I discover that I need to add a new index, or modify an existing one. This is where index tuning becomes an art. It's a lot friends, which is why it's ironic that I initially thought about stating that index tuning was easy.
A shared vision At Dynatrace, weve built a comprehensive observability platform that already includes deep database visibility, the Top Database Statements view, and Grail for unified data storage and analysis. Stay tuned for updates, and as always, thank you for being part of the Dynatrace community.
Automatic data capture and display: More data, including span attributes, is available for out-of-the-box analysis, with no additional configuration necessary. The team decides to dig into the “prod” namespace to perform exploratory analysis of their critical production workloads. s – 7.24 s) to investigate further.
How to fine-tune failure detection. To see all the exceptions, use the “view exception analysis” button. The post How to fine tune failure detection appeared first on Dynatrace blog. Typically, when things go badly wrong, unexpected exceptions are triggered and they won’t be caught by the code so Dynatrace will detect them.
You may also like: Java Out of Memory Heap Analysis. What happens when you're out of memory? Recently we experienced an interesting production problem. This application was running on multiple AWS EC2 instances behind Elastic Load Balancer. The application was running on a GNU/Linux OS, Java 8, Tomcat 8 application server.
Thread dumps are now a thing of the past; the future belongs to 24×7 continuous thread analysis. Identify and solve performance bottlenecks faster with continuous thread analysis. You’ll find this new feature in the CPU profiler at Diagnostic tools > CPU analysis.
Most performance engineers have spent years submitting RFPs, developing scripts, executions, analysis, monitoring and tuning, and researching their specific projects/product domains and have gained a very high level of expertise in it. and must have extensive experience in specialized skills.
I took a big-data-analysis approach, which started with another problem visualization. I wanted to understand how I could tune Dynatrace’s problem detection, but to do that I needed to understand the situation first. I wanted to run a statistical analysis on the event and problem data generated by Dynatrace across all environments.
Dynatrace automatic root-cause analysis and intelligent automation enables organizations to accelerate their cloud journey, reduce complexity, and achieve greater agility in their digital transformation efforts. Dynatrace, OneAgent, and the Dynatrace logo are trademarks of the Dynatrace, Inc. group of companies.
The following are key insights from our extensive experimental analysis: Flink, Kafka Streams, and Spark Structured Streaming are resilient to different types and degrees of failure. From the Kafka Streams community, one of the configurations mostly tuned in production is adding standby replicas. Recovery time of the latency p90.
In times where weekly/biweekly software releases are the norm, in environments with thousands of applications, and when the introduction of new bugs is inevitable, we strongly believe that manual approaches to error detection and analysis are no longer feasible. Fine tune what Davis AI considers for alerting.
With the advent and ingestion of thousands of custom metrics into Dynatrace, we’ve once again pushed the boundaries of automatic, AI-based root cause analysis with the introduction of auto-adaptive baselines as a foundational concept for Dynatrace topology-driven timeseries measurements.
Stay tuned for an upcoming blog series where we’ll give you a more hands-on walkthrough of how to ingest any kind of data from StatsD, Telegraf, Prometheus, scripting languages, or our integrated REST API. So you get auto-adaptive baselining for custom metrics and Davis automated root cause analysis from Day 1.
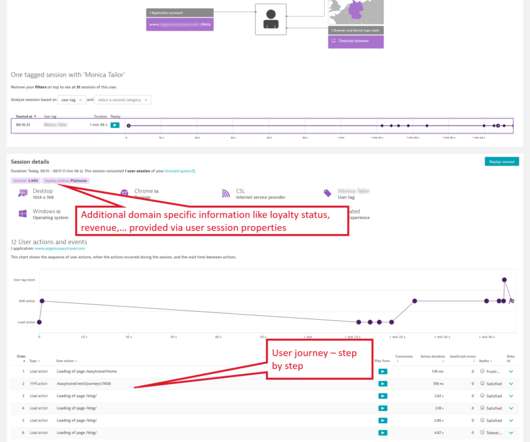
After configuration, you’ll find a new section in the Multidimensional analysis page that holds a list of all key user actions. Fine-tune problem detection by setting individual anomaly detection rules for your key user actions. Change the Apdex and anomaly detection configuration. Remove the action from key user actions.
Today we’re happy to announce the new Crash analysis page, which helps you focus on individual app versions and react to issues early, before they affect the experience of a larger group of users. The Dynatrace crash analysis workflow is available to you out of the box. This is a only a small update to our Crash analysis page.
Tracing becomes simple thanks to an easy and extensible approach that leverages existing Dynatrace technology, such as PurePath® distributed tracing for end-to-end, automatic, code-level visibility, and Davis, the Dynatrace AI engine, for root-cause-analysis. Stay tuned for updates. New to Dynatrace? trial page ?for recent blogs.
AIOps brings an additional level of analysis to observability, as well as the ability to respond to events that warrant it. Expect to spend time fine-tuning automation scripts as you find the right balance between automated and manual processing. By tuning workflows, you can increase their efficiency and effectiveness.
Data analysis within large and highly dynamic microservices environments is the biggest challenge that Application Performance Monitoring (APM) vendors face today. The real challenge is robust and effective analysis of such data. Why are we doing this? OpenTelemetry instrumentation will be automatically picked up by Dynatrace OneAgent.
You can now seamlessly expand your analysis of the root cause of any problem identified by Davis ® AI with logs automatically available in the correct context of hosts, applications, or other identifiers specific to your environment. Next you can start using logs in your troubleshooting and analysis tasks.
Instrumentation enables the shipment of a monitoring library with your app that collects telemetry data and sends it back to the Dynatrace platform for analysis. This includes selecting the app to be instrumented, fine-tuning cost controls, and enabling users to opt-in to Session Replay recording.
In-depth analysis of delivery tasks using tools like Notebooks. Stay tuned Currently, the API allows for the configuration of an event processing pipeline. Fine-tune: Perform data normalization by creating an OpenPipeline configuration that extracts properties according to the SDLC specification.
An analysis of performance evolution of Linux’s core operations Ren et al., Perhaps the most interesting lesson/reminder is this: it takes a lot of effort to tune a Linux kernel. Google’s data center kernel is carefully performance tuned for their workloads. SOSP’19. to protect against Meltdown and Spectre ) ). (4)
Without any coding, these extensions make it easy to ingest data from these technologies and provide tailor-made analysis views and zero-config alerting. Effective analysis of metrics requires more context, especially understanding of the dependencies between applications and respective components and how they relate to other telemetry data.
Whenever you want to explore and analyze any of the Core Web Vitals, simply start on the Synthetic or RUM multidimensional analysis page, where you can filter for synthetic monitor actions or RUM user actions. Here’s how a similar analysis of Largest contentful paint and Cumulative layout shift would work for synthetic browser monitors.
Therefore, we’re happy to announce support for OpenTracing data that’s emitted by auto- and custom-instrumentation of Java source code with Dynatrace PurePath 4, our distributed tracing and code-level analysis technology. Stay tuned for upcoming announcements around OpenTracing and OpenTelemetry. Deep-code execution details.
Metrics are stored for easy analysis on dashboards, definition of service level objectives, and more. All dependencies are auto-detected and used for root cause analysis. We’re evolving the automated analysis of all enterprise application traces, metrics, and logs in context to supercharge observability. So, stay tuned.
The data is also used by security and other partner teams for insight and incident analysis. After several iterations of the architecture and some tuning, the solution has proven to be able to scale.
Log analytics simplified: Deeper insights, no DQL required Your team will immediately notice the streamlined log analysis capabilities below the histogram. Stay tuned for even wider support of log data embedded seamlessly into the context of Dynatrace Apps, and better ways to get answers from logs without writing queries.
Dynatrace has continuously extended and improved PurePath to the point where it now provides industry-leading transaction capturing and code-level analysis for the broadest set of technologies, with some additional and unique capabilities: Frontend to backend. Automatic topology analysis. Near-zero overhead.
With the first drill down into the multidimensional analysis, you can start focusing on the problem timeframe, as shown below. Once you pick a particular error from the top error list on the multidimensional analysis view, Dynatrace gives you immediate insight into the occurrence statistics of the error. Stay tuned for Part 2.
You’ll learn how to create production SLOs, to continuously improve the performance of services, and I’ll guide you on how to become a champion of your sport by: Creating calculated metrics with the help of multidimensional analysis. The Multi-Dimensional analysis will allow you to extract all types of metrics to detect this.
Without an observability platform to collect and process signals, and provide AI-powered answers for problem detection, root cause identification, and impact analysis, the migration to ARM remains only a roadmap item for many AIOps teams. In the following example, a synthetic monitor is set up for webpage uptime monitoring.
It has undergone security analysis and testing in accordance with AWS requirements. As we know how much work intelligent data analysis requires, we embrace the idea of OpenTelemetry to standardize how data is collected and sent to Dynatrace. Stay tuned for more news about the availability of trace ingest in the coming months.
Log monitoring, log analysis, and log analytics are more important than ever as organizations adopt more cloud-native technologies, containers, and microservices-based architectures. “Logging” is the practice of generating and storing logs for later analysis. Dynatrace news. billion in 2020 to $4.1 What is log monitoring?
Traces are used for performance analysis, latency optimization, and root cause analysis. It integrates with existing observability tools, enhancing data collection and analysis while providing standardized data formats for deeper insights and improved interoperability. Integration with existing tools.
In talking to customers internally and externally, we recognized that some of our analysis views, like the CPU analysis , are in fact ultimately what our users need, however they remain overlooked capabilities of our platform. Stay tuned for even more improvements to diagnostic workflows in Dynatrace. What’s next?
We organize all of the trending information in your field so you don't have to. Join 5,000+ users and stay up to date on the latest articles your peers are reading.
You know about us, now we want to get to know you!
Let's personalize your content
Let's get even more personalized
We recognize your account from another site in our network, please click 'Send Email' below to continue with verifying your account and setting a password.


Let's personalize your content