This site uses cookies to improve your experience. To help us insure we adhere to various privacy regulations, please select your country/region of residence. If you do not select a country, we will assume you are from the United States. Select your Cookie Settings or view our Privacy Policy and Terms of Use.
Cookie Settings
Cookies and similar technologies are used on this website for proper function of the website, for tracking performance analytics and for marketing purposes. We and some of our third-party providers may use cookie data for various purposes. Please review the cookie settings below and choose your preference.
Used for the proper function of the website
Used for monitoring website traffic and interactions
Cookie Settings
Cookies and similar technologies are used on this website for proper function of the website, for tracking performance analytics and for marketing purposes. We and some of our third-party providers may use cookie data for various purposes. Please review the cookie settings below and choose your preference.
Strictly Necessary: Used for the proper function of the website
Performance/Analytics: Used for monitoring website traffic and interactions
With the release of Dynatrace version 1.249, the Davis® AI Causation Engine provides broader support to subsequent Kubernetes issues and their impact on business continuity like: Automated Kubernetes root cause analysis. Automated Kubernetes root cause analysis: a paradigm shift. Davis AI targeting Kubernetes orchestration.
Time series analysis is a statistical technique used to analyze and interpret data that is collected over time. The analysis of time series data involves understanding the underlying patterns in the data, predicting future trends, and identifying the factors that contribute to the observed patterns.
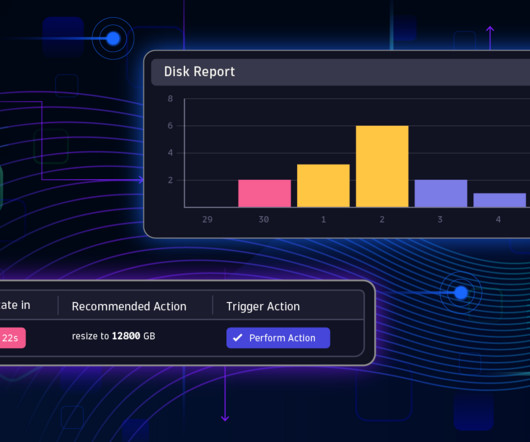
In an era dominated by automated, code-driven software deployments through Kubernetes and cloud services, human operators simply can’t keep up without intelligent observability and root cause analysis tools. The chart feature allows for quick analysis of problem peaks at specific times.
Time series analysis is a specialized branch of statistics that involves the study of ordered, often temporal data. Whether you are a novice just starting out or an experienced data scientist looking to hone your skills, this guide offers valuable insights into the complex yet intriguing world of time series analysis.
This article takes a plunge into the comparative analysis of these two cult technologies, highlights the critical performance metrics concerning scalability considerations, and, through real-world use cases, gives you the clarity to confidently make an informed decision. However, the question arises of choosing the best one.
Efficient log management strategies, such as implementing structured logging, using log aggregation tools, and applying machine learning for log analysis, are crucial for handling this data effectively. It offers a faster, more insightful, and automated log data analysis. It is a brand new capability of CloudWatch.
AI data analysis can help development teams release software faster and at higher quality. AI observability and data observability The importance of effective AI data analysis to organizational success places a burden on leaders to better ensure that the data on which algorithms are based is accurate, timely, and unbiased.
A unified platform approach also makes OpenTelemetry data available to more teams across the organization for more diversified analysis. By automatically detecting these OpenTelemetry endpoints, Davis AI adds the endpoints to its service list for analysis and alerting with no additional setup or configuration required.
This makes time series analysis unique and requires specialized techniques and models to understand and predict future patterns or trends. Time series data represents a sequence of data points collected over time. Unlike other data types, time series data has a temporal aspect, where the order and timing of the data points matter.
The first article of the series ( Time Series Analysis: VARMAX-As-A-Service ) compares statistical and machine learning models as being both mathematical models and provides an end-to-end implementation of a VARMAX-based statistical model for macroeconomic forecast using a Python library called statsmodels.
This example is a good starting point for exploratory analysis with context-aware Dynatrace Davis insights. Apply relevant signals in context for exploratory analysis. Going deeper into this example shows how Dynatrace provides an unprecedented level of exploratory analysis for both OneAgent and other data sources.
Automatic data capture and display: More data, including span attributes, is available for out-of-the-box analysis, with no additional configuration necessary. The team decides to dig into the “prod” namespace to perform exploratory analysis of their critical production workloads. s – 7.24 s) to investigate further.
AIOps combines big data and machine learning to automate key IT operations processes, including anomaly detection and identification, event correlation, and root-cause analysis. However, AIOps makes it possible to automate key tasks, such as error detection, alert analysis, and event reporting. What is AIOps, and how does it work?
Unlike correlation-based machine learning, which calculates probabilities based on statistics, causal AI uses fault-tree analysis to determine system-level failures based on component-level failures. Predictive analysis helps an organization manage resources and improve incident response times.
This blog post will provide a detailed analysis of replay traffic testing, a versatile technique we have applied in the preliminary validation phase for multiple migration initiatives. After replaying the requests, this dedicated service also records the responses from the production and replay paths for offline analysis.
Dynatrace addresses this issue by providing unified ingest and analysis of container vulnerability findings across cloud and container registries. Data mapping The ingested data is mapped according to the Dynatrace Semantic Dictionary, ensuring a unified format for analysis. For instructions, see the documentation.
With AIOps, it is possible to detect anomalies automatically with root-cause analysis and remediation support. To predict events before they happen, causality graphs are used in conjunction with sequence analysis to determine how chains of dependent application or infrastructure incidents might lead to slowdowns, failures, or outages.
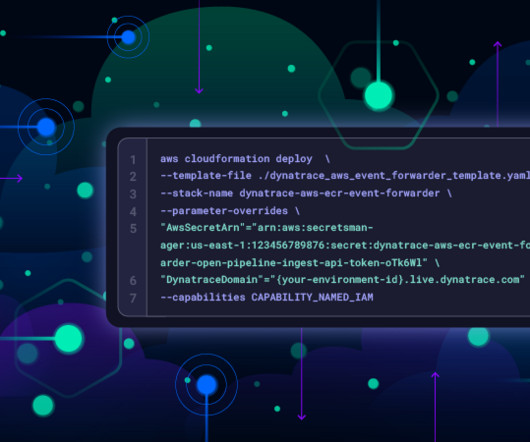
The more data ingestion channels you provide to the Dynatrace Davis® AI engine, the more comprehensive Dynatrace automated root cause analysis becomes. This integration with AWS Firehose simplifies observability by removing intermediary components, which allows seamless log capture and analysis directly in the Grail data lakehouse.
This allows you to build customized visualizations with Dashboards or perform in-depth analysis with Notebooks. ” — DT community user How the new Synthetic app better supports root cause analysis (RCA) As always, Dynatrace listens to your feedback! Details of requests sent during each monitor execution are also available.
Davis AI root cause analysis is used to pinpoint the problem, entity, and root cause. Davis AI predictive analysis can be used to decrease downtime by remediating problems before they hit production. In-context topology identification. A holistic view of your data and environments with Grail™ data lakehouse.
And when outages do occur, Dynatrace AI-powered, automatic root-cause analysis can also help them to remediate issues as quickly as possible. Hypermodal AI fuels automatic root-cause analysis to pinpoint the culprit amongst millions of service interdependencies and lines of code faster than humans can grasp.
Data proliferation—as well as a growing need for data analysis—has accelerated. Any analysis, any time: Dynatrace Log Management and Analytics powered by Grail — blog Log management and analytics are key to any company’s observability strategy. Digital transformation shows no signs of slowing down.
Predictive traffic analysis Deploying OneAgent within the staging environment facilitates the availability of telemetry data for analysis by Davis AI. Davis AI can leverage this data to enable predictive analysis. To illustrate this concept, consider the scenario below.
Dynatrace Grail™ and Davis ® AI act as the foundation, eliminating the need for manual log correlation or analysis while enabling you to take proactive action. This shortens root cause analysis dramatically, as explained in our recent blog post Full Kubernetes logging in context from Fluent Bit to Dynatrace.
Fast and efficient log analysis is critical in todays data-driven IT environments. Segments vs. filters: Finding the perfect balance While both segments and filter fields help streamline log analysis, they serve distinct purposes: Segments are usually pre-defined by power users or Dynatrace administrators and shared across teams.
Easy access to exception details in the context of a full trace for exception analysis Expanded log insights for your applications Only Dynatrace enables true and unified observability across all ingested logs, including infrastructure components and hyperscalers providing backend services or cloud-native frontend applications.
That’s why it makes sense to collect logs from every node and send them to some sort of central location outside the Kubernetes cluster for persistence and later analysis. Since pods are ephemeral as well, managing Kubernetes logs is challenging.
It also breaks down silos across the technology stack, allowing for rapid, scalable analysis and automation to prevent issues before they impact users. This unified approach enables teams to identify, investigate, and resolve security vulnerabilities in cloud-native applications.
Figure 3: Funnel analysis implemented by selecting a custom user journey. AWS cloud cost analysis To optimize cloud spend, the FinOps team at Dynatrace built a solution that automatically ingests hourly Amazon Web Services (AWS) billing data on a daily basis as BizEvents into a Dynatrace Grail™ bucket.
Dynatrace integrates with Tenable to provide a single pane of glass for security findings across various environments and products, allowing unified analysis, prioritization, and orchestration of findings.
It uses fault-tree analysis to identify the component events that cause outcomes at a higher level. Causal AI applies a deterministic approach to anomaly detection and root-cause analysis that yields precise, continuous, and actionable insights in real time. That’s where causal AI can help.
It stores the metrics in a time-series database and provides the powerful PromQL query language for efficient analysis and data visualization. The platform uses a pull-based architecture to collect metrics from various targets.
Traces are used for performance analysis, latency optimization, and root cause analysis. It integrates with existing observability tools, enhancing data collection and analysis while providing standardized data formats for deeper insights and improved interoperability. Integration with existing tools.
5, including: Configuration Change Control and CM-4 – Impact Analysis now requires privacy impact analysis for configuration changes. The result is a more effective security posture. FedRAMP increased emphasis on privacy, which takes center stage in Rev.5,
Dynatrace automatic root-cause analysis and intelligent automation enables organizations to accelerate their cloud journey, reduce complexity, and achieve greater agility in their digital transformation efforts.
Financial data engineering in SAS involves the management, processing, and analysis of financial data using the various tools and techniques provided by the SAS software suite. Here are some key aspects of financial data engineering in SAS: 1.
Runtime vulnerability analysis. Runtime vulnerability analysis helps reduce the time and cost to find and fix application vulnerabilities. Dynatrace logs these events so teams can review important change details, such as when the change was made, who made it, and what was changed.
In data analysis, the need for fast query execution and data retrieval is paramount. Among numerous database management systems, ClickHouse stands out for its originality and, one could say, a specific niche, which, in my opinion, complicates its expansion in the database market.
Customer experience analytics is the systematic collection, integration, and analysis of data related to customer interactions and behavior with an organization and/or its products and services. Defining clear objectives will guide your analysis efforts and help maintain focus on extracting the most relevant and actionable information.
With PurePath® distributed tracing, method hotspots, service flows, memory, and GC analysis, Dynatrace earned its reputation.Since then, Spring and Dynatrace have matured and improved, especially for containers, cloud integrations, and Kubernetes. We can begin exploratory analysis using some example traces where delivery failures occurred.
How To Find Your Application’s GC Thread Count You can determine your application’s GC thread count by doing a thread dump analysis as outlined below: In this post, we will discuss why JVM can end up having too many/too few GC threads, the consequences of it, and potential solutions to address them.
A shared vision At Dynatrace, weve built a comprehensive observability platform that already includes deep database visibility, the Top Database Statements view, and Grail for unified data storage and analysis.
We organize all of the trending information in your field so you don't have to. Join 5,000+ users and stay up to date on the latest articles your peers are reading.
You know about us, now we want to get to know you!
Let's personalize your content
Let's get even more personalized
We recognize your account from another site in our network, please click 'Send Email' below to continue with verifying your account and setting a password.


Let's personalize your content