This site uses cookies to improve your experience. To help us insure we adhere to various privacy regulations, please select your country/region of residence. If you do not select a country, we will assume you are from the United States. Select your Cookie Settings or view our Privacy Policy and Terms of Use.
Cookie Settings
Cookies and similar technologies are used on this website for proper function of the website, for tracking performance analytics and for marketing purposes. We and some of our third-party providers may use cookie data for various purposes. Please review the cookie settings below and choose your preference.
Used for the proper function of the website
Used for monitoring website traffic and interactions
Cookie Settings
Cookies and similar technologies are used on this website for proper function of the website, for tracking performance analytics and for marketing purposes. We and some of our third-party providers may use cookie data for various purposes. Please review the cookie settings below and choose your preference.
Strictly Necessary: Used for the proper function of the website
Performance/Analytics: Used for monitoring website traffic and interactions
With the release of Dynatrace version 1.249, the Davis® AI Causation Engine provides broader support to subsequent Kubernetes issues and their impact on business continuity like: Automated Kubernetes root cause analysis. Automated Kubernetes root cause analysis: a paradigm shift. Davis AI targeting Kubernetes orchestration.
Time series analysis is a statistical technique used to analyze and interpret data that is collected over time. The analysis of time series data involves understanding the underlying patterns in the data, predicting future trends, and identifying the factors that contribute to the observed patterns.
In an era dominated by automated, code-driven software deployments through Kubernetes and cloud services, human operators simply can’t keep up without intelligent observability and root cause analysis tools. The chart feature allows for quick analysis of problem peaks at specific times.
Time series analysis is a specialized branch of statistics that involves the study of ordered, often temporal data. Whether you are a novice just starting out or an experienced data scientist looking to hone your skills, this guide offers valuable insights into the complex yet intriguing world of time series analysis.
This article takes a plunge into the comparative analysis of these two cult technologies, highlights the critical performance metrics concerning scalability considerations, and, through real-world use cases, gives you the clarity to confidently make an informed decision. However, the question arises of choosing the best one.
Automatic data capture and display: More data, including span attributes, is available for out-of-the-box analysis, with no additional configuration necessary. The team decides to dig into the “prod” namespace to perform exploratory analysis of their critical production workloads. s – 7.24 s) to investigate further.
Efficient log management strategies, such as implementing structured logging, using log aggregation tools, and applying machine learning for log analysis, are crucial for handling this data effectively. It offers a faster, more insightful, and automated log data analysis. It is a brand new capability of CloudWatch.
With AIOps, it is possible to detect anomalies automatically with root-cause analysis and remediation support. To predict events before they happen, causality graphs are used in conjunction with sequence analysis to determine how chains of dependent application or infrastructure incidents might lead to slowdowns, failures, or outages.
This allows you to build customized visualizations with Dashboards or perform in-depth analysis with Notebooks. ” — DT community user How the new Synthetic app better supports root cause analysis (RCA) As always, Dynatrace listens to your feedback! Details of requests sent during each monitor execution are also available.
AI data analysis can help development teams release software faster and at higher quality. AI observability and data observability The importance of effective AI data analysis to organizational success places a burden on leaders to better ensure that the data on which algorithms are based is accurate, timely, and unbiased.
A unified platform approach also makes OpenTelemetry data available to more teams across the organization for more diversified analysis. By automatically detecting these OpenTelemetry endpoints, Davis AI adds the endpoints to its service list for analysis and alerting with no additional setup or configuration required.
This makes time series analysis unique and requires specialized techniques and models to understand and predict future patterns or trends. Time series data represents a sequence of data points collected over time. Unlike other data types, time series data has a temporal aspect, where the order and timing of the data points matter.
The first article of the series ( Time Series Analysis: VARMAX-As-A-Service ) compares statistical and machine learning models as being both mathematical models and provides an end-to-end implementation of a VARMAX-based statistical model for macroeconomic forecast using a Python library called statsmodels.
It also breaks down silos across the technology stack, allowing for rapid, scalable analysis and automation to prevent issues before they impact users. This unified approach enables teams to identify, investigate, and resolve security vulnerabilities in cloud-native applications.
Dynatrace integrates with Tenable to provide a single pane of glass for security findings across various environments and products, allowing unified analysis, prioritization, and orchestration of findings.
Dynatrace automatic root-cause analysis and intelligent automation enables organizations to accelerate their cloud journey, reduce complexity, and achieve greater agility in their digital transformation efforts.
Runtime vulnerability analysis. Runtime vulnerability analysis helps reduce the time and cost to find and fix application vulnerabilities. Dynatrace logs these events so teams can review important change details, such as when the change was made, who made it, and what was changed.
Causal AI-based risk analysis: Reduce false positives and automatically prioritize and route vulnerabilities to developers with automated risk analysis, similar to configuration/compliance issues routed to SREs.
Fortunately, the Spring Boot framework offers a powerful observability stack that streamlines real-time monitoring and performance analysis. Diagnosing issues within complex microservice architectures can quickly become a time-consuming and daunting task.
Fast and efficient log analysis is critical in todays data-driven IT environments. Segments vs. filters: Finding the perfect balance While both segments and filter fields help streamline log analysis, they serve distinct purposes: Segments are usually pre-defined by power users or Dynatrace administrators and shared across teams.
Percentiles to simplify analysis Percentiles are statistical measures that divide a data set into 100 equal parts, providing a way to interpret specific points within your histograms. In practical applications, percentiles are particularly useful for web performance analysis.
When working with the Kubernetes cluster dashboard, you have two options for digging deeper into further analysis, both using the Kubernetes app. Leveraging the capabilities of Grail and Smartscape® topology, Dynatrace seamlessly integrates logs, metrics, and traces to offer enhanced context for troubleshooting and in-depth analysis.
Based on your requirements, you can select one of three approaches for Davis AI anomaly detection directly from any time series chart: Auto-Adaptive Threshold: This dynamic, machine-learning-driven approach automatically adjusts reference thresholds based on a rolling seven-day analysis, continuously adapting to changes in metric behavior over time.
A shared vision At Dynatrace, weve built a comprehensive observability platform that already includes deep database visibility, the Top Database Statements view, and Grail for unified data storage and analysis.
Add context to AWS Security Hub findings The Dynatrace platform, powered by OpenPipeline , provides unified security event ingest and analysis across tools and cloud environments. Findings are mapped to Dynatrace semantic conventions and stored in Grail data lakehouse, allowing you to uniformly access and analyze your ingested data.
Leveraging code-level insights and transaction analysis, Dynatrace Runtime Application Protection automatically detects attacks on applications in your environment. Site Reliability Guardian provides an automated change impact analysis to validate service availability, performance, and capacity objectives across various systems.
This integration enables advanced analysis, visualization, and reporting on runner and workflow performance within the Dynatrace platform. When your data is in Dynatrace, the possibilities for analysis and visualization are virtually limitless. However, these use cases are just the beginning.
Good visualizations are not just static, unintelligent data presentations; they enable interaction and ideally serve as a starting point for subsequent analysis. The Dynatrace Notebooks and Dashboards apps are the perfect starting point for visualizing and understanding your data for monitoring or in-depth analysis.
Acting as the middlemen, Collectors hide all the pesky little details, allowing OpenTelemetry exporters to focus on generating data, and OpenTel backends to focus on storage and analysis. The Collector is expected to be ready for prime time in 2025, reaching the v1.0
Explore every detail of your traces with in-depth exception analysis, providing easy access to exception details with full trace context. Example: Exception analysis Understanding patterns, especially regarding exceptions, is no easy feat. These powerful insights can easily be transformed into interactive dashboards.
A metric can therefore be defined once in DJ and be made available across analytics dashboards and experimentation analysis. dashboarding, analysis, research, etc.). DJ has a strong pedigreethere are several prior semantic layers in the industry (e.g. Minerva at Airbnb; dbt Transform, Looker, and AtScale as paid solutions).
The Grail architecture ensures scalability, making log data accessible for detailed analysis regardless of volume. With real-time analysis, you gain faster data-driven decisions and simplified data ingestion. Dynatrace Grail lets you focus on extracting insights rather than managing complex schemas or index and storage concepts.
Overall, misattribution makes fleet-wide dependency analysis impractical. Moreover, the waiting period made the data less fresh, reducing its utility for real-time analysis. As a workaround, we made FlowCollector hold received flows for 15 minutes before attribution, allowing time for delayed IP address change events.
Dynatrace Davis® AI uses a three-tiered AI approach, which combines predictive, causal, and generative AI to provide customers with precise root cause analysis and deep insights into their environments and workloads. At Dynatrace, AI is at the heart of everything we do.
Run analysis of your system(s) by selecting Run analysis. Run the analysis to find asystems affected by VMSA-2025-0004. When the analysis is complete, select Vulnerabilities from the left navigation menu. If the Definitions database version is lower than 6.9.10.1, perform an update by selecting Update definitions now.
By automating root-cause analysis, TD Bank reduced incidents, speeding up resolution times and maintaining system reliability. To improve this, they turned to Dynatrace for AI-driven automation to accelerate problem detection and resolution. The result?
Dynatrace aggregates logs from both the Windows and Linux worker nodes automatically, enabling search, filter, and analysis of logs also from a single interface. Whether an issue is specific to a Linux node, a Windows node, or a cross-platform service, AI-driven insights from Dynatrace enable quick root cause analysis and resolution.
All Dynatrace Apps that support log analysis display an Add logs button, where you can configure log ingestion. During this process, OneAgent detects and links technologies , such as Java, Docker, or Microsoft IIS, for improved parsing and log analysis. You can add additional logs at any time.
Efficiently searching and analyzing customer data — such as identifying user preferences for movie recommendations or sentiment analysis — plays a crucial role in driving informed decision-making and enhancing user experiences.
How To Fix Largest Contentful Issues With Subpart Analysis How To Fix Largest Contentful Issues With Subpart Analysis Matt Zeunert 2025-03-06T10:00:00+00:00 2025-03-06T14:50:25+00:00 This article is sponsored by DebugBear The Largest Contentful Paint (LCP) in Core Web Vitals measures how quickly a website loads from a visitors perspective.
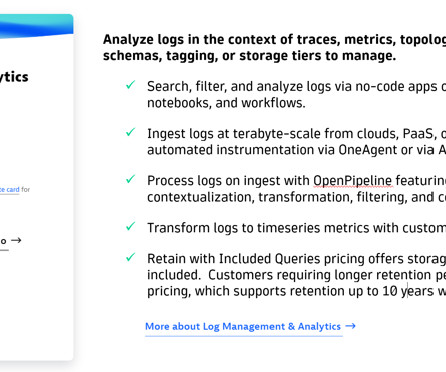
This pricing flexibility allows customers to optimize their log analysis expenses by paying only for what they use. Usage-based pricing is ideal for organizations with longer retention requirements and known query patterns.
The Dynatrace solution Dynatrace addresses these issues by providing unified security event ingest and analysis for security findings across tools and products. As part of this integration, we provide ready-made documents that can serve as a starting point for your data analysis and automation use cases.
Structured logging has become essential in modern applications to simplify the analysis of logs and improve observability. Spring Boot 3.4 extends the logging capabilities of Spring Framework 6.2. This can be easily configured log formats using application.yml or application.properties. and Spring Boot 3.4.
147
147
Input your email to sign up, or if you already have an account, log in here!
Enter your email address to reset your password. A temporary password will be e‑mailed to you.
We organize all of the trending information in your field so you don't have to. Join 5,000+ users and stay up to date on the latest articles your peers are reading.
You know about us, now we want to get to know you!
Let's personalize your content
Let's get even more personalized
We recognize your account from another site in our network, please click 'Send Email' below to continue with verifying your account and setting a password.


Let's personalize your content