This site uses cookies to improve your experience. To help us insure we adhere to various privacy regulations, please select your country/region of residence. If you do not select a country, we will assume you are from the United States. Select your Cookie Settings or view our Privacy Policy and Terms of Use.
Cookie Settings
Cookies and similar technologies are used on this website for proper function of the website, for tracking performance analytics and for marketing purposes. We and some of our third-party providers may use cookie data for various purposes. Please review the cookie settings below and choose your preference.
Used for the proper function of the website
Used for monitoring website traffic and interactions
Cookie Settings
Cookies and similar technologies are used on this website for proper function of the website, for tracking performance analytics and for marketing purposes. We and some of our third-party providers may use cookie data for various purposes. Please review the cookie settings below and choose your preference.
Strictly Necessary: Used for the proper function of the website
Performance/Analytics: Used for monitoring website traffic and interactions
Although most MongoDB drivers try to abstract this event, developers should understand and design their applications for such behavior, as applications should expect transient network errors and retry before percolating errors up. 1305:12 @(shell):1:1 2019-04-18T19:44:42.261+0530 I NETWORK [thread1] trying reconnect to SG-example-1.servers.mongodirector.com:27017
In 2019, Netflix moved thousands of container hosts to bare metal. Among its many uses, BPF can be used to create powerful performance-analysis tools capable of analyzing everything: CPUs, memory, disks, file systems, networking, languages, applications, and more.
If you hadn’t already heard the news, the entire Dynatrace team is immensely proud to once again been positioned as a Leader in the Gartner 2019 Magic Quadrant for Application Performance Monitoring (APM). Our platform needed a full-stack approach, including virtual network infrastructure, containers, applications, and users.
Every day around the world, millions of trips take place across the Uber network, giving users more reliable transportation through ridesharing, bikes, and scooters, drivers and truckers additional opportunities to earn, employees and employers more convenient business travel, and hungry … The post Uber Infrastructure in 2019: Improving Reliability, (..)
As of August 2019, there are currently over 50,000 LinkedIn DevOps job listings in the United States alone. DevOps Engineers must be both good software developers and infrastructure experts and, as such, they are expected to know Linux infrastructure, networking, algorithms, and DevOps tools such as Terraform, Docker, and Kubernetes.
Read on to find out which is the best MongoDB GUI for you, updated for 2019, that contain these key features: A good visual editor to write and edit queries faster. Performance monitoring tools display database metrics such as read and write operations, number of client requests, memory and network usage, and number of page faults.
That's why, in 2019, they had an idea: Build a data lake that can support one of the largest logistics networks on the planet. The Galaxy data lake was built in 2019 and now all the various teams are working on moving their data into it. The team is constantly looking for ways to get more accurate data, faster.
October 2, 2019 – ScaleGrid, a rapidly growing leader in the Database-as-a-Service (DBaaS) space, has just launched their new fully managed Redis on Azure service. PALO ALTO, Calif., Redis Cloud Gets Easier with Fully Managed Hosting on Microsoft Azure Click To Tweet.
There was already a telecommunication network, which became the backbone of the internet. There was already a transportation network called the US Postal Service, and Royal Mail, and Deutsche Post, all over the world, that could deliver our packages. All of the heavy-lifting infrastructure was already in place for it.
We’re happy to announce the General Availability of cross-environment dashboarding capabilities (having released this functionality in an Early Adopter release with Dynatrace version 1.172 back in June 2019). Important : In Dynatrace Managed environments, you need to configure an additional Network scope setting.
Having released this functionality in an Preview Release back in September 2019, we’re now happy to announce the General Availability of our Citrix monitoring extension. Tie latency issues to host and virtualization infrastructure network quality. Dynatrace news. It’s the ultimate indicator of whether “Citrix is slow.”.
Our journey began in 2019 with the introduction of the Dynatrace Citrix monitoring extension. Expand Citrix monitoring to include NetScaler or F5 BigIP Activate NetScaler or BigIP extensions that fit your environment and benefit from complete visibility into the application delivery chain, including the network tier.
In 2019, Gartner reported that 30% of organizations worldwide were running containerized applications. To function effectively, containers need to be able to communicate with each other and with network services. Network scanners that see systems from the “outside” perspective. Network scanners.
Having released this functionality in an Early Adopter Release with OneAgent version 1.173 and Dynatrace version 1.174 back in August 2019, we’re now happy to announce the General Availability of OneAgent full-stack monitoring for Linux on the IBM Z platform, sometimes informally referred to as Z/Linux. Dynatrace news.
By replacing branch-heavy algorithms with neural networks, the DBMS can profit from these hardware trends.". @copyconstruct : "GPUs will increase 1000× in performance by 2025, whereas Moore’s law for CPUs essentially is dead. billion user's names, addresses, naughty/nice statuses, and the times they are asleep in their homes.
Among its many uses, BPF can be used to create powerful performance-analysis tools capable of analyzing everything: CPUs, memory, disks, file systems, networking, languages, applications, and more. We share everything attendees need to implement CloudTrail in their own organizations.
Among its many uses, BPF can be used to create powerful performance-analysis tools capable of analyzing everything: CPUs, memory, disks, file systems, networking, languages, applications, and more. We share everything attendees need to implement CloudTrail in their own organizations.
Stand under Explain the Cloud Like I'm 10 (35 nearly 5 star reviews). 10% : Netflix captured screen time in US; 8.3 7x : faster PyPy python; 9B : gallons of water/day for lawns; 2.6
Having released this functionality in a Preview Release back in October 2019, we’re now happy to announce the General Availability of our SAP ABAP real user monitoring. Was it the server, the network, or the database that caused the degraded response time? Dynatrace news. Understand the root cause of the degraded GUI response time.
Editor’s note: Sophia was one of the recipients of the Best Paper Award at MICRO 2019. About the Author: Sophia Shao is an Assistant Professor of the EECS department at University of California, Berkeley.
Uptime Institute’s 2022 Outage Analysis report found that over 60% of system outages resulted in at least $100,000 in total losses, up from 39% in 2019. The growing amount of data processed at the network edge, where failures are more difficult to prevent, magnifies complexity.
At the APAC Partner Summits, there were lots of learning, networking, and celebration. And the 2019 Dynatrace Partner Awards goes to……. Growth Partner of the Year. Technical Readiness Partner of the Year. Rising Partner of the Year. Australia & New Zealand. Winner Partner of the Year: DXC Technology.
When we wanted to add a location, we had to ship hardware and get someone to install that hardware in a rack with power and network. But I’m not sure that’s a real issue in 2019. Historically, there have been several challenges with synthetic and I think it’s helpful to demonstrate these and why we’ve moved to cloud: Things were slow.
Failure can occur due to a myriad of reasons: misbehaving clients that trigger a retry storm, an under-scaled service in the backend, a bad deployment, a network blip, or issues with the cloud provider. Netflix experienced a similar issue with the same potential impact as the outage seen in 2019.
Recognized as the fastest growing database by popularity, PostgreSQL was named the DBMS of the year in both 2018 and 2017 by DB-Engines, and continues to grow in popularity in 2019. In fact, PostgreSQL is so popular, 11.5% Oracle does offer discounts on their pricing, where you can receive a 10% discount if you purchase online.
This short blog post is a follow up to the announcement we made on May 6, 2019: OneAgent for Windows—Enhancements to *.msi-based Smaller network and Dynatrace cluster storage footprint. Dynatrace news. msi-based deployment. One of our design principles is to make sure that Dynatrace is as easy to set up and use as possible.
channel surround sound in 2010, Dolby Atmos in 2017 , and adaptive bitrate audio in 2019. In 2019, we began delivering high-quality, adaptive bitrate audio to TVs. By Phill Williams and Vijay Gondi Introduction At Netflix, we are passionate about delivering great audio to our members. We began streaming 5.1
As of 2019, ProgrammableWeb provides searchable access to almost 22,000 APIs, with more being added on a daily basis. They are, of course, not a complete solution, as they can be intercepted like any other network traffic. Dynatrace news. APIs are the connective tissue in today’s online services.
Network measurements with per-interface and per-process resolution. OneAgent for Z/Linux collects a number of network metrics: input and output traffic measured in bytes and packets, retransmissions, and connectivity. Network metrics are also collected for detected processes. Disk measurements with per-disk resolution.
Reconstructing a streaming session was a tedious and time consuming process that involved tracing all interactions (requests) between the Netflix app, our Content Delivery Network (CDN), and backend microservices. The process started with manual pull of member account information that was part of the session.
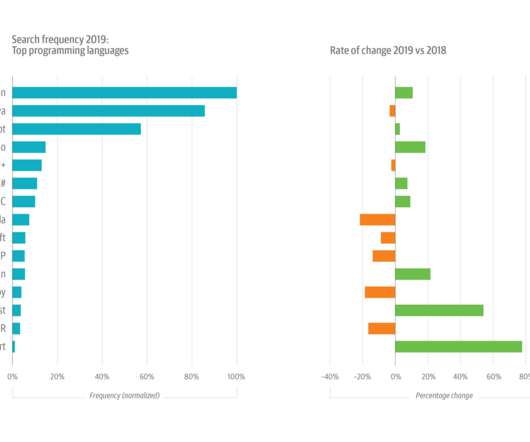
Growth is still strong for such a large topic, but usage slowed in 2018 (+13%) and cooled significantly in 2019, growing by just 7%. But sustained interest in cloud migrations—usage was up almost 10% in 2019, on top of 30% in 2018—gets at another important emerging trend. Still cloud-y, but with a possibility of migration.
It's an inclusive event for speakers, attendees, and vendors alike to network and learn from each other in a safe, comfortable, and accessible environment. Monitorama is the event of the year if you're in the monitoring and observability space! Did you know?
50,000 : images in a National Geographic shoot; 11 billion : Voyager 2 miles traveled; 83% : AI papers originate outside the US; 80% : network partitions lead to catastrophic failures; 97% : large AWS customers use auto scaling; 82% : startup failures due to cashflow problems; $115.7 ChappellTracker : So here's something.
In one week’s time, thousands of IT and business professionals will descend on London for the latest iteration of DevOps Enterprise Summit London 2019 (June 25-27 – InterContinental O2, London, UK). Here are four tips to get the most out of DOES London 2019: Tip #1 – Develop a plan of attack. The countdown is on.
” Despite the slow rate of adoption, Java’s six-month release cadence has been trucking along—Java 12 dropped in March 2019, with Java 13 following in September. 2019 brought another surprise when Oracle moved Java SE to a subscription-based model. Or do people just not know about the benefits of 11 in containers?”
The easiest way to induce failover is to run the rs.stepDown() command: RS-example-0:PRIMARY> rs.stepDown() 2019-04-18T19:44:42.257+0530 E QUERY [thread1] Error: error doing query: failed: network error while attempting to run command 'replSetStepDown' on host 'SG-example-1.servers.mongodirector.com:27017' 27017 (sg-example-17026.servers.mongodirector.com:27017,
In February 2019 we announced a Preview of the OneAgent command-line interface (CLI) solution, which allows for easier post-installation host-group reconfiguration. You can expect the following parameters to appear shortly: Get/set network zones (This is an upcoming feature; please check for our announcement on this topic soon.).
support has been extended and will reach end of life in November 2019. This previous version of OneAgent for AIX introduced improved detection of IP addresses for network interfaces. support will reach end of life in April 2019. x—(Pivotal support for this version ended in April 2019. Added support for Go 1.12.
Distributed traces are extended with code-level execution trees that include useful information such as CPU time, suspension time, and network I/O time. Also be sure to register for our online performance clinic about distributed tracing on September 18, 2019. Take a look at my blog post on W3C Trace Context to learn more.
October 2, 2019 – ScaleGrid, a rapidly growing leader in the Database-as-a-Service (DBaaS) space, has just launched their new fully managed Hosting on Azure for Redis™ service. PALO ALTO, Calif., Cloud reliability has never been so important,” says Dharshan Rangegowda, Founder and CEO of ScaleGrid.
as it matures 5G is predicted to improve network speeds dramatically. Carriers are predicting download speeds in 2019 for anywhere from 100Mb to 1 Gbit per second on average. But Scott continues: Faster networks should fix our performance problems, but so far, they have had an interesting if unintentional impact on the web.
This blog post gives a glimpse of the computer systems research papers presented at the USENIX Annual Technical Conference (ATC) 2019, with an emphasis on systems that use new hardware architectures. USENIX ATC is a top-tier venue with a broad range of systems research papers from both industry and academia. Heterogeneous ISA. Final words.
Receive a metric for the timespan between two given dates in the past: from=2019-12-21T05:57:01.123+01:00&to=2019-12-22T05:57:01.123+01:00. Receive a metric for a given date and time aligned with a specific URC timezone: from=2019-12-21T05:57:01.123+01:00. Receive the timestamp in UTC millisecond format: from=1558963489634.
Training examples were produced between 2016 and 2019, in 13 countries, with 60% of the titles originating in the USA. We adapted the SOTA convolutional recurrent neural network ( CRNN ) architecture to accommodate our requirements for input/output dimensionality and model complexity.
We organize all of the trending information in your field so you don't have to. Join 5,000+ users and stay up to date on the latest articles your peers are reading.
You know about us, now we want to get to know you!
Let's personalize your content
Let's get even more personalized
We recognize your account from another site in our network, please click 'Send Email' below to continue with verifying your account and setting a password.


Let's personalize your content